Watch Now This tutorial has a related video course created by the Real Python team. Watch it together with the written tutorial to deepen your understanding: Python Basics: Finding and Fixing Code Bugs
Everyone makes mistakes—even seasoned professional developers! Python’s interactive interpreter, IDLE, is pretty good at catching mistakes like syntax errors and runtime errors, but there’s a third type of error that you may have already experienced. Logic errors occur when an otherwise valid program doesn’t do what was intended. Logic errors cause unexpected behaviors called bugs. Removing bugs is called debugging.
A debugger is a tool that helps you hunt down bugs and understand why they’re happening. Knowing how to find and fix bugs in your code is a skill that you’ll use for your entire coding career!
In this tutorial, you’ll:
- Learn how to use IDLE’s Debug Control window
- Practice debugging on a buggy function
- Learn alternative methods for debugging your code
Note: This tutorial is adapted from the chapter “Finding and Fixing Code Bugs” in Python Basics: A Practical Introduction to Python 3.
The book uses Python’s built-in IDLE editor to create and edit Python files and interact with the Python shell, so you will see references to IDLE’s built-in debugging tools throughout this tutorial. However, you should be able to apply the same concepts to the debugger of your choice.
Free Bonus: 5 Thoughts On Python Mastery, a free course for Python developers that shows you the roadmap and the mindset you’ll need to take your Python skills to the next level.
Use the Debug Control Window
The main interface to IDLE’s debugger is the Debug Control window, or the Debug window for short. You can open the Debug window by selecting Debug→Debugger from the menu in the interactive window. Go ahead and open the Debug window.
Note: If the Debug menu is missing from your menu bar, then make sure to bring the interactive window into focus by clicking it.
Whenever the Debug window is open, the interactive window displays [DEBUG ON] next to the prompt to indicate that the debugger is open. Now open a new editor window and arrange the three windows on your screen so that you can see all of them simultaneously.
In this section, you’ll learn how the Debug window is organized, how to step through your code with the debugger one line at a time, and how to set breakpoints to help speed up the debugging process.
The Debug Control Window: An Overview
To see how the debugger works, you can start by writing a simple program without any bugs. Type the following into the editor window:
 1for i in range(1, 4):
 2    j = i * 2
 3    print(f"i is {i} and j is {j}")
Save the file, then keep the Debug window open and press F5. You’ll notice that execution doesn’t get very far.
The Debug window will look like this:
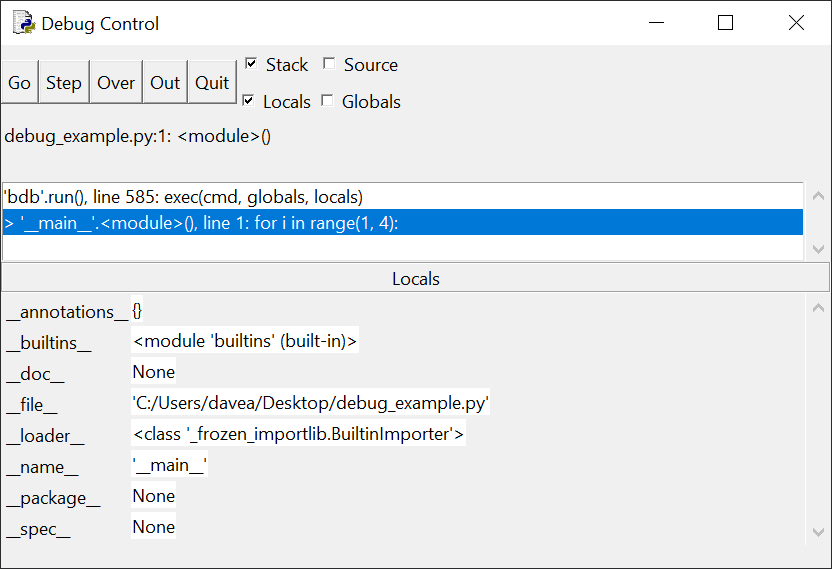
Notice that the Stack panel at the top of the window contains the following message:
> '__main__'.<module>(), line 1: for i in range(1, 4):
This tells you that line 1 (which contains the code for i in range(1, 4):) is about to be run but hasn’t started yet. The '__main__'.module() part of the message refers to the fact that you’re currently in the main section of the program, as opposed to being, for example, in a function definition before the main block of code has been reached.
Below the Stack panel is a Locals panel that lists some strange looking stuff like __annotations__, __builtins__, __doc__, and so on. These are internal system variables that you can ignore for now. As your program runs, you’ll see variables declared in the code displayed in this window so that you can keep track of their value.
There are five buttons located at the top left-hand corner of the Debug window: Go, Step, Over, Out, and Quit. These buttons control how the debugger moves through your code.
In the following sections, you’ll explore what each of these buttons does, starting with Step.
The Step Button
Go ahead and click Step at the top left-hand corner of the Debug window. The Debug window changes a bit to look like this:
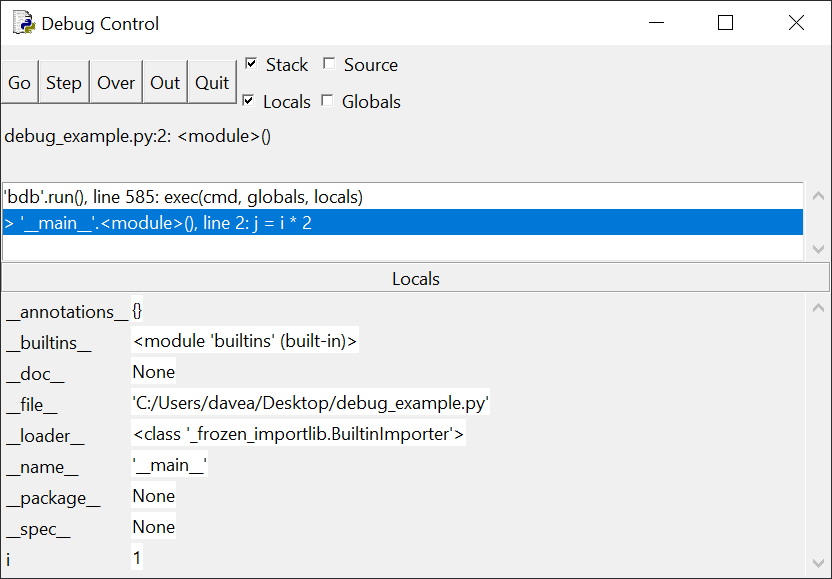
There are two differences to pay attention to here. First, the message in the Stack panel changes to the following:
> '__main__'.<module>(), line 2: j = i * 2:
At this point, line 1 of your code has run, and the debugger has stopped just before executing line 2.
The second change to notice is the new variable i that is assigned the value 1 in the Locals panel. That’s because the for loop in the first line of code created the variable i and assigned it the value 1.
Continue hitting the Step button to walk through your code line by line, and watch what happens in the debugger window. When you arrive at the line print(f"i is {i} and j is {j}"), you can see the output displayed in the interactive window one piece at a time.
More importantly, you can track the growing values of i and j as you step through the for loop. You can probably imagine how beneficial this feature is when trying to locate the source of bugs in your programs. Knowing each variable’s value at each line of code can help you pinpoint where things go wrong.
Breakpoints and the Go Button
Often, you may know that the bug must be in a particular section of your code, but you may not know precisely where. Rather than clicking the Step button all day long, you can set a breakpoint that tells the debugger to continuously run all code until it reaches the breakpoint.
Breakpoints tell the debugger when to pause code execution so that you can take a look at the current state of the program. They don’t actually break anything.
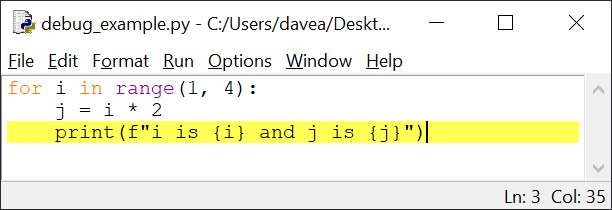
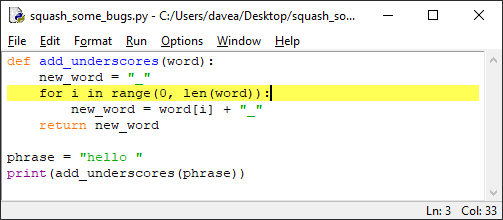
To set a breakpoint, right-click (Ctrl-click on a Mac) the line of code in your editor window that you would like to pause at and select Set Breakpoint. IDLE highlights the line in yellow to indicate that your breakpoint has been set. To remove a breakpoint, right-click the line with the breakpoint and select Clear Breakpoint.
Go ahead and press Quit at the top of the Debug window to turn off the debugger for now. This won’t close the window, and you’ll want to keep it open because you’ll be using it again in just a moment.
Set a breakpoint on the line of code with the print() statement. The editor window should now look like this:
Save and run the file. Just like before, the Stack panel of the Debug window indicates that the debugger has started and is waiting to execute line 1. Click Go and watch what happens in the Debug window:
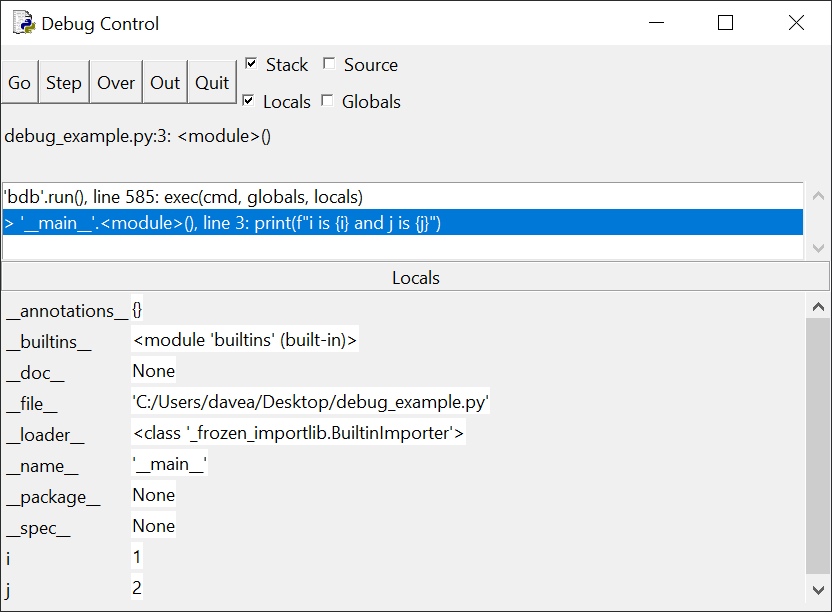
The Stack panel now shows the following message indicating that it’s waiting to execute line 3:
> '__main__'.<module>(), line 3: print(f"i is {i} and j is {j}")
If you look at the Locals panel, then you’ll see that both variables i and j have the values 1 and 2, respectively. By clicking Go, you told the debugger to run your code continuously until it reached either a breakpoint or the end of the program. Press Go again. The Debug window now looks like this:
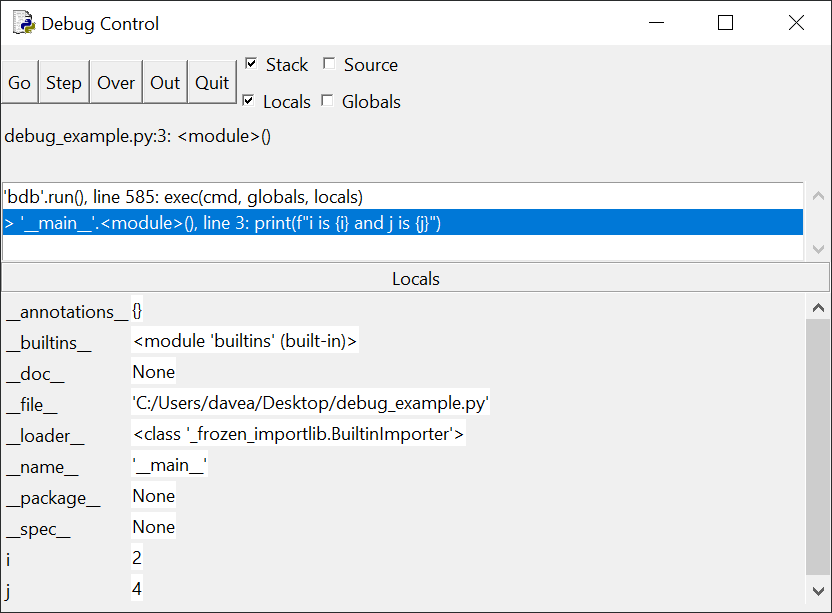
Do you see what changed? The same message as before is displayed in the Stack panel, indicating that the debugger is waiting to execute line 3 again. However, the values of the variables i and j are now 2 and 4. The interactive window also displays the output from having run the line with print() the first time through the loop.
Each time you press the Go button, the debugger runs the code continuously until it reaches the next breakpoint. Since you set the breakpoint on line 3, which is inside the for loop, the debugger stops on this line each time it goes through the loop.
Press Go a third time. Now i and j have the values 3 and 6. What do you think will happen when you press Go one more time? Since the for loop only iterates three times, when you press Go again, the program will finish running.
Over and Out
The Over button works sort of like a combination of Step and Go. It steps over a function or a loop. In other words, if you’re about to step into a function with the debugger, then you can still run that function’s code without having to step all the way through each line of it. The Over button takes you directly to the result of running that function.
Likewise, if you’re already inside a function or loop, then the Out button executes the remaining code inside the function or loop body and then pauses.
In the next section, you’ll look at some buggy code and learn how to fix it with IDLE.
Squash Some Bugs
Now that you’ve gotten comfortable with using the Debug Control window, let’s take a look at a buggy program.
The following code defines a function add_underscores() that takes a single string object word as an argument and returns a new string containing a copy of word with each character surrounded by underscores. For example, add_underscores("python") should return "_p_y_t_h_o_n_".
Here’s the buggy code:
def add_underscores(word):
    new_word = "_"
    for i in range(len(word)):
        new_word = word[i] + "_"
    return new_word

phrase = "hello"
print(add_underscores(phrase))
Type this code into the editor window, then save the file and press F5 to run the program. The expected output is _h_e_l_l_o_, but instead all you see is o_, or the letter "o" followed by a single underscore.
If you already see what the problem with the code is, don’t just fix it. The point of this section is to learn how to use IDLE’s debugger to identify the problem.
If you don’t see what the problem is, don’t worry! By the end of this section, you’ll have found it and will be able to identify similar problems in other code you encounter.
Note: Debugging can be difficult and time consuming, and bugs can be subtle and hard to identify.
While this section looks at a relatively basic bug, the method used to inspect the code and find the bug is the same for more complex problems.
Debugging is problem solving, and as you become more experienced, you’ll develop your own approaches. In this section, you’ll learn a simple four-step method to help get you started:
- Guess which section of code may contain the bug.
- Set a breakpoint and inspect the code by stepping through the buggy section one line at a time, keeping track of important variables along the way.
- Identify the line of code, if any, with the error and make a change to solve the problem.
- Repeat steps 1–3 as needed until the code works as expected.
Step 1: Make a Guess About Where the Bug Is Located
The first step is to identify the section of code that likely contains the bug. You may not be able to identify exactly where the bug is at first, but you can usually make a reasonable guess about which section of your code has an error.
Notice that the program is split into two distinct sections: a function definition (where add_underscores() is defined), and a main code block that defines a variable phrase with the value "hello" and then prints the result of calling add_underscores(phrase).
Look at the main section:
phrase = "hello"
print(add_underscores(phrase))
Do you think the problem could be here? It doesn’t look like it, right? Everything about those two lines of code looks good. So, the problem must be in the function definition:
def add_underscores(word):
    new_word = "_"
    for i in range(len(word)):
        new_word = word[i] + "_"
    return new_word
The first line of code inside the function creates a variable new_word with the value "_". You’re all good there, so you can conclude that the problem is somewhere in the body of the for loop.
Step 2: Set a Breakpoint and Inspect the Code
Now that you’ve identified where the bug must be, set a breakpoint at the start of the for loop so that you can trace out exactly what’s happening inside the code with the Debug window:
Open the Debug window and run the file. Execution still pauses on the very first line it sees, which is the function definition.
Press Go to run through the code until the breakpoint is encountered. The Debug window will now look like this:
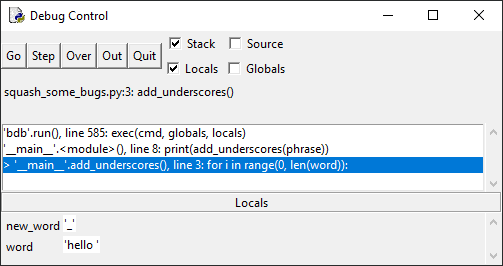
At this point, the code is paused just before entering the for loop in the add_underscores() function. Notice that two local variables, word and new_word, are displayed in the Locals panel. Currently, word has the value "hello" and new_word has the value "_" as expected.
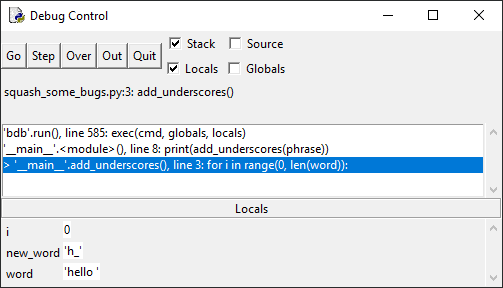
Click Step once to enter the for loop. The Debug window changes, and a new variable i with the value 0 is displayed in the Locals panel:
i is the counter used in the for loop, and you can use it to keep track of which iteration of the for loop you’re currently looking at.
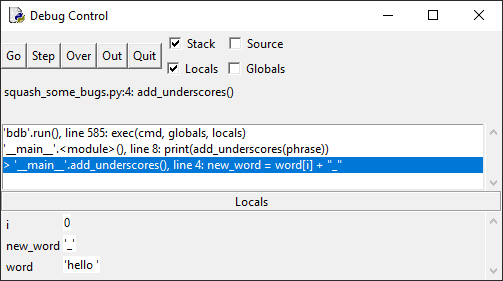
Click Step one more time. If you look at the Locals panel, then you’ll see that the variable new_word has taken on the value "h_":
This isn’t right. Originally, new_word had the value "_", and on the second iteration of the for loop it should now have the value "_h_". If you click Step a few more times, then you’ll see that new_word gets set to e_, then l_, and so on.
Step 3: Identify the Error and Attempt to Fix It
The conclusion you can make at this point is that, at each iteration of the for loop, new_word is overwritten with the next character in the string "hello" and a trailing underscore. Since there’s only one line of code inside the for loop, you know that the problem must be with the following code:
new_word = word[i] + "_"
Look at the line closely. It tells Python to get the next character of word, tack an underscore onto the end of it, and assign this new string to the variable new_word. This is exactly the behavior you’ve witnessed by stepping through the for loop!
To fix the problem, you need to tell Python to concatenate the string word[i] + "_" to the existing value of new_word. Press Quit in the Debug window, but don’t close the window just yet. Open the editor window and change the line inside the for loop to the following:
new_word = new_word + word[i] + "_"
Step 4: Repeat Steps 1 to 3 Until the Bug Is Gone
Save the new changes to the program and run it again. In the Debug window, press Go to execute the code up to the breakpoint.
Note: If you closed the debugger in the previous step without clicking Quit, then you may see the following error when reopening the Debug window:
You can only toggle the debugger when idle
Always be sure to click Go or Quit when you’re finished with a debugging session instead of just closing the debugger, or you might have trouble reopening it. To get rid of this error, you’ll have to close and reopen IDLE.
The program pauses just before entering the for loop in add_underscores(). Press Step repeatedly and watch what happens to the new_word variable at each iteration. Success! Everything works as expected!
Your first attempt at fixing the bug worked, so you don’t need to repeat steps 1–3 anymore. This won’t always be the case. Sometimes you’ll have to repeat the process several times before you fix a bug.
Alternative Ways to Find Bugs
Using a debugger can be tricky and time consuming, but it’s the most reliable way to find bugs in your code. Debuggers aren’t always available, though. Systems with limited resources, such as small Internet of Things devices, often won’t have built-in debuggers.
In situations like these, you can use print debugging to find bugs in your code. Print debugging uses print() to display text in the console that indicates where the program is executing and what the state of the program’s variables are at certain points in the code.
For example, instead of debugging the previous program with the Debug window, you could add the following line to the end of the for loop in add_underscores():
print(f"i = {i}; new_word = {new_word}")
The altered code would then look like this:
def add_underscores(word):
    new_word = "_"
    for i in range(len(word)):
        new_word = word[i] + "_"
        print(f"i = {i}; new_word = {new_word}")
    return new_word

phrase = "hello"
print(add_underscores(phrase))
When you run the file, the interactive window displays the following output:
i = 0; new_word = h_
i = 1; new_word = e_
i = 2; new_word = l_
i = 3; new_word = l_
i = 4; new_word = o_
o_
This shows you what the value of new_word is at each iteration of the for loop. The final line containing just a single underscore is the result of running print(add_underscore(phrase)) at the end of the program.
By looking at the above output, you can come to the same conclusion you did while debugging with the Debug window. The problem is that new_word is overwritten at each iteration.
Print debugging works, but it has several disadvantages over debugging with a debugger. First, you have to run your entire program each time you want to inspect the values of your variables. This can be an enormous waste of time compared to using breakpoints. You also have to remember to remove those print() function calls from your code when you’re done debugging!
The example loop in this section may be a good example for illustrating the process of debugging, but it’s not the best example of Pythonic code. The use of the index i is a giveaway that there might be a better way to write the loop.
One way to improve this loop is to iterate over the characters in word directly. Here’s one way to do that:
def add_underscores(word):
    new_word = "_"
    for letter in word:
        new_word = new_word + letter + "_"
    return new_word
The process of rewriting existing code to be cleaner, easier to read and understand, or more in line with the standards set by a team is called refactoring. We won’t discuss refactoring in this tutorial, but it’s an essential part of writing professional-quality code.
Conclusion: Python Debugging With IDLE
That’s it! You now know all about debugging using IDLE’s Debug window. You can use the basic principles you used here with a number of different debugging tools. You’re now well equipped to start debugging your Python code.
In this tutorial, you learned:
- How to use IDLE’s Debug Control window to inspect the values of variables
- How to insert breakpoints to take a closer look at how your code works
- How to use the Step, Go, Over, and Out buttons to track down bugs line by line
You also got some practice debugging a faulty function using a four-step process for identifying and removing bugs:
- Guess where the bug is located.
- Set a breakpoint and inspect the code.
- Identify the error and attempt to fix it.
- Repeat steps 1 to 3 until the error is fixed.
Debugging is as much an art as it is a science. The only way to master debugging is to get a lot of practice with it! One way to get some practice is to open the Debug Control window and use it to step through your code as you work on the exercises and challenges you find in other Real Python tutorials.
For more information on debugging Python code, check out Python Debugging With Pdb. If you enjoyed what you learned in this sample from Python Basics: A Practical Introduction to Python 3, then be sure to check out the rest of the book.
Watch Now This tutorial has a related video course created by the Real Python team. Watch it together with the written tutorial to deepen your understanding: Python Basics: Finding and Fixing Code Bugs


