Key Features • Get Access • Installation • Usage • License
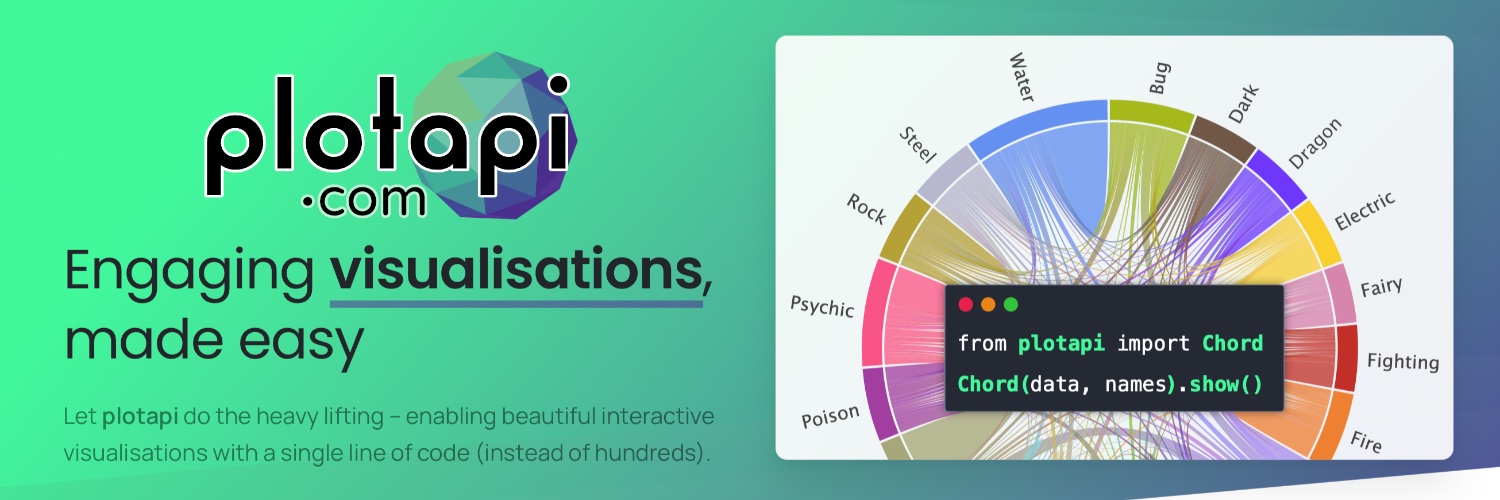
- PlotAPI Chord - Illustrate inter-relationships between data.
- PlotAPI Sankey - Illustrate the flow from one set of values to another.
- PlotAPI Terminus - Illustrate distributing something out amongst recipients.
- PlotAPI Bar Fight - A beautiful take on the classic Bar Chart Race.
- PlotAPI Pie Fight - A beautiful take on the classic Pie Chart Race.
- PlotAPI Heat Map - Beautiful and interactive heat maps.
- PlotAPI Line Fight - A beautiful take on the classic Line Chart Race.
- PlotAPI Pareto Front - Illustrate non-dominated (Pareto) fronts over time.
- Upcoming Visualisations - Access to new visualisations as they are introduced.
- Supports Most Programming Languages - Get started with any language able to make HTTP requests.
- First-Class Python Support - Get started with pip install plotapi
- Jupyter Lab/Notebook + Google Colab Support - Super-charge your notebooks with inline visualisations.
- Beautiful Themes & Fonts - Select from pre-made beautiful themes, or add your own.
- Share or Embed Interactive HTML - Download and embed your interactive visualisations.
- Render to PDF, SVG, or PNG - Generate high-quality output ready for print.
- Record Animation to Video - Create social media-ready animated visualisations.
Visit the website to get access to PlotAPI.
Get up and running with Python with the following command.
pip install plotapiout.mp4
Chord(matrix, names).show()matrix = [
[0, 5, 6, 4, 7, 4],
[5, 0, 5, 4, 6, 5],
[6, 5, 0, 4, 5, 5],
[4, 4, 4, 0, 5, 5],
[7, 6, 5, 5, 0, 4],
[4, 5, 5, 5, 4, 0],
]
names = ["Action", "Adventure", "Comedy", "Drama", "Fantasy", "Thriller"]sankey.mp4
Sankey(links).show()links = [
{"source":"Salary", "target":"Me", "value": 40000},
{"source":"Freelance", "target":"Me", "value": 10000},
{"source":"Dividends", "target":"Me", "value": 6000},
{"source":"Me", "target":"Rent", "value": 1100*12},
{"source":"Me", "target":"Food", "value": 300*12},
{"source":"Me", "target":"Magazine Subscription", "value": 2000},
{"source":"Me", "target":"Personal Tax", "value": 6000},
{"source":"Me", "target":"Investments", "value": 30000},
{"source":"Investments", "target":"Facebook", "value": 8000},
{"source":"Investments", "target":"Amazon", "value": 7000},
{"source":"Investments", "target":"Apple", "value": 6000},
{"source":"Investments", "target":"Netflix", "value": 5000},
{"source":"Investments", "target":"Google", "value": 4000},
]MIT

plotapi.com · GitHub @shahinrostami · Twitter @shahinrostami · A Polyra innovation