Blog Post on Data Experiment with fNIRS - Hemodynamic Response Data
This repo explains how to get started with fNIRS sensing data specifically oxygenated hemoglobin “HbO2/HbO” data for analyzing a data stream from a sensor, in this case Blueberry.
The goal here is to help with understanding how to take the sensor data signal and get to a point where clear increases and decreases in thinking intensity are shown during a period of use. In this tutorial we will use a sample dataset to start with.
In this post we explore two core concepts with fNIRS data:
- Experiments to determine a clean ‘brain activity’ signal
- Comparing ‘brain activity’ with a secondary source of data, typing speed
Install the required libraries for scikit learn and pandas (tools for managing the
data + performing some of the initial analysis) - this notebook was built using Python 3 Kernel.
Explore initial types of analysis to run on fNIRS data, most statistical analysis
will try out 4 in this tutorial:
Standard Deviation
Mean/Average
Rolling Average
Volatility and Change in Rolling Average
In each case a window of time is selected to get a snapshot of what the data looks like.
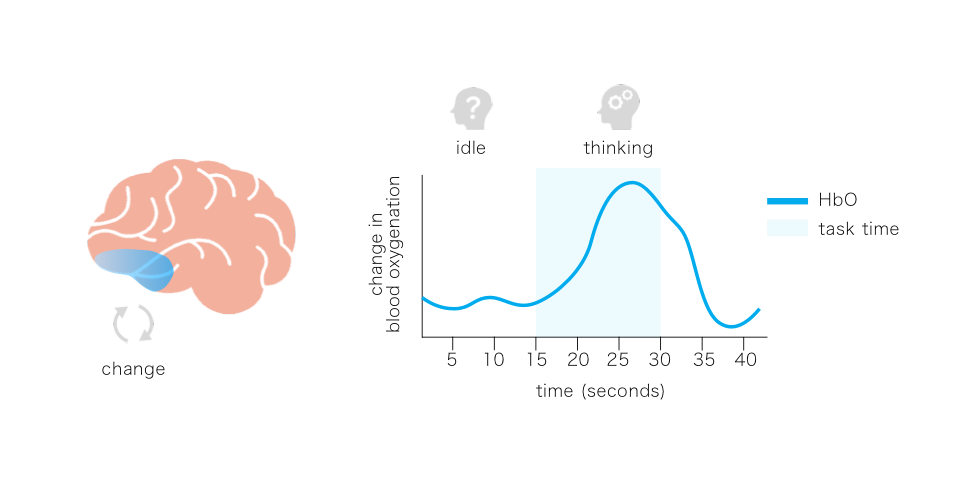
Hemodynamic responses in fNIRS data typically occur over a 5 to 25 second window of time.
From the rolling average of the HbO change it becomes possible to see a pattern or rhythm
of rise and fall of HbO during a task period. In the sample data provided over it is
possible to see the overall rise and fall 2 times. Rhythmic Mayer Waves are present in
blood flow data though!
Potential methods to determining the 'brain activity' signal from the Mayer Waves
To account for this rhythmic signal within the data we can filter the dataset to
try to get the overall trend.
Exploring potential rate of change and volatility as a method to explore clearer
identification of periods where overall increasing rates of change of HbO2 become
evident in the signal to determine a level of brain activity or mental effort/stress
- this is one sample set of data from a period of work
Experimenting volatility and standard deviation to determine an impact of higher
or lower rate of change in overall trend of HbO2 changes as measured by the sensor
Comparing to WPM to HbO2. Here is the preliminary result which shows an increase
in brain activity at points of difficulty during the writing session.
This was a fun self assessment to see what changes could be identified.