
Programming is an art, and bugs are an inevitable part of the creative process. Every developer encounters errors in their code – there's really no exception to it.
Because of this, understanding how to effectively debug is a crucial skill that can save you time and frustration.
In this tutorial, we will delve into the fundamentals of debugging Python code. We'll explore common error messages, leverage the community, and utilize print statements to identify and resolve issues. The primary goal is to identify and fix errors in your code, and the key to successful debugging lies in a systematic approach.
Table of Contents
- SyntaxError: invalid syntax
- IndentationError: unexpected indent
- NameError: name 'variable' is not defined
- AttributeError: 'module' object has no attribute 'attribute_name'
- FileNotFoundError: [Errno 2] No such file or directory: 'filename'
- IndexError: list index out of range
- ImportError: No module named 'module_name'
- TypeError
- ValueError
3. Foundational Debugging Techniques
4. Advanced Debugging Techniques
7. Some Additional Tips for Efficient Debugging
8. How to Search for Solutions to Bugs and Errors
Common Code Error Messages
Before moving on to debugging, let's first examine some common error messages and their meanings:
If you're already familiar with common code error messages, feel free to skip this section and move straight to the Debugging Techniques.
1. SyntaxError: invalid syntax
This error occurs when the Python interpreter encounters code that doesn't follow the correct syntax rules. It could be a missing parenthesis, a misplaced colon, or some other syntax-related issue.
To fix these types of errors, check for missing syntax elements and ensure proper pairing of quotes, parentheses, and brackets.
2. IndentationError: unexpected indent
Python relies on indentation to define code blocks. This error occurs when indentation is inconsistent or incorrect.
To avoid these errors, ensure proper and consistent indentation using spaces or tabs as required by the programming language.
3. NameError: name 'variable' is not defined
These types of errors can result from attempting to use a variable or function that hasn't been defined.
Make sure to check for typos in variable or function names, and make sure they are defined before use.
4. AttributeError: 'module' object has no attribute 'attribute_name'
You may get this type of error when trying to access an attribute or method that doesn't exist for a module or object.
To fix this, review the code and confirm that the attribute or method being called is correct and available.
5. FileNotFoundError: [Errno 2] No such file or directory: 'filename'
You'll get this error when attempting to access a file that doesn't exist.
You should check the file path and make sure the file exists at the specified location.
6. IndexError: list index out of range
This type of error happens when you're trying to access an index in a sequence (like a list or a string) that doesn't exist. The same error can happen for strings and tuples for the same reason.
To fix it, make sure that the index being used is within the valid range of the sequence.
7. ImportError: No module named 'module_name'
You'll get this error if you attempt to import a module that isn't installed or accessible.
To avoid this, install the required module using a package manager (pip) or check the module name for typos.
8. TypeError:
This is a common exception in Python that occurs when an operation or function is applied to an object of an inappropriate type. Here are some common types of TypeError:
TypeError: unsupported operand type(s) for +: 'type1' and 'type2': This error occurs when trying to perform an operation on two objects with incompatible types. For example, attempting to add a string and an integer or multiply a list by a string.TypeError: function_name() takes X positional arguments but Y were given: This error occurs when calling a function with an incorrect number of arguments. It indicates that the function expects a specific number of arguments, but a different number is provided.TypeError: 'int' object is not callable: This error occurs when you try to call an object as if it were a function, but it's not callable. For example, attempting to call an integer.
9. ValueError:
This type of error occurs when a function receives an argument of the correct type but with an inappropriate value.
ValueError: invalid literal for int() with base X: 'non-numeric': This occurs when attempting to convert a string to an integer usingint(), but the string is not a valid representation of an integer in the specified base (X). For example, trying to convert a non-numeric string or a string with an invalid format (for example, containing letters) to an integer.ValueError: could not convert string to float: 'non-numeric': This happens when trying to convert a string to a floating-point number usingfloat(), but the string is not a valid representation of a number. Similar to the first case, it often involves non-numeric characters or an incorrect format.ValueError: invalid literal for int() with base 10: 'non-numeric': Similar to the first case, this error occurs when trying to convert a string to an integer usingint(), but the string is not a valid numeric representation in base 10. It is a more general form of the first type, where the base is explicitly set to 10.ValueError: unhashable type: 'mutable_type': This error occurs when trying to use a mutable type (for example, list, dictionary) as a key in a dictionary or as an element in a set. Dictionaries and sets require keys and elements to be of a hashable (immutable) type. To resolve this, convert the mutable type to an immutable one or consider a different data structure that supports mutable elements.
Understanding these common errors provides a foundation for effective debugging.
How to Debug Python Code
Now that you understand some common error types, let's explore various techniques and tools that can help you debug your Python code efficiently.
Foundational Debugging Techniques:
Print Statements
When you're writing code, especially in complex programs, it's essential to understand how your code is executing and the values of variables at different points in the program. Print statements allow you to insert messages in your code that get printed to the console or terminal when the program runs.
By strategically placing print statements at different parts of your code, you can create a log of sorts that shows the order in which different sections of your code are being executed. This can help you understand the control flow and pinpoint where the program might be deviating from your expectations.
Here's an example:
def my_function(x, y):
    print("Entering my_function")
    print(f'x: {x}, y: {y}')
    result = x + y
    print(f'Result: {result}')
    print("Exiting my_function")
    return result
While print statements are often the quickest and most straightforward way to get a glimpse into a program's execution flow, especially during initial development., they can be cumbersome to manage and may not be appropriate for production code and therefore comes Logging, which provides a structured way to record information.
Logging
Logging is like writing notes while your program runs. Instead of just printing things to the screen, you write them to a log. It helps you keep track of what your program is doing, especially when things go wrong.
You can configure logging to control the level of detail in log messages and specify where the logs should go. This could be the console, a file, or other destinations.
Logging Levels:
- DEBUG: Detailed information, useful for developers during debugging.
- INFO: General information about what's happening in the program.
- WARNING: Indicates something unexpected happened, but the program can still continue.
- ERROR: Something went wrong, and the program can't proceed as planned.
- CRITICAL: A very serious error, possibly causing the program to crash.
Here's an example of logging:
import logging

logging.basicConfig(level=logging.Info)

def example_function(x, y):
    logging.debug(f"Input values: x={x}, y={y}")
    result = x + y
    logging.debug(f"Result: {result}")
    return result

result = example_function(3, 7)

# Logging an error message
if result > 10:
logging.error("Result exceeds the expected maximum.")level=logging.INFOsets the root logger's level toINFO. This means that log messages with severityINFOand above will be captured, while messages with a lower severity (such asDEBUG) will be ignored. It writes logs to a file namedexample.log- Inside the
example_function,logging.debug()is used to log information about input values and the result. These messages will only be displayed if the logging level is set toDEBUGor lower. - An error message is logged using
logging.error()if the result exceeds the expected maximum (in this case, 10). - Logging can be configured to write messages to both the console and a file named
example.log. Theformatparameter can be used to customize the appearance of log messages, including the timestamp, log level, and the actual log message.
# Optional
logging.basicConfig(
    filename='example.log',
    format='%(asctime)s - %(levelname)s - %(message)s',
    level=logging.DEBUG
)

# this format includes the timestamp, module name, and log level in each log message.
Note : In larger applications, it's common to use loggers instead of the root logger directly. This approach allows for more granular control over logging in different parts of the application. You can read more about logging and loggers here.
To learn more about logging and loggers in Python, check out this blog: https://www.samyakinfo.tech/blog/logging-in-python
Exception Handling
Wrap suspicious code blocks with try-except statements to catch and handle exceptions. This prevents your program from crashing abruptly, allowing you to gracefully handle errors and log relevant information.
The try-except statement is a way to handle exceptions in Python. Here's a basic structure:
try:
    result = x / y
except ExceptionType as e:
    print(f"An exception of type {type(e).__name__} occurred: {e}")
    # Additional handling logic, if needed
tryBlock: Contains the code that might raise an exception.exceptBlock: Contains the code that is executed if an exception of the specified type occurs in thetryblock.- Exception Type: Specifies the type of exception to catch. You can catch specific exceptions or a more general
Exceptiontype to catch any exception. as e:: Assigns the exception object to the variablee, allowing you to access information about the exception.
def safe_divide(x, y):
    try:
        result = x / y
        print(f"Result: {result}")
    except ZeroDivisionError as e:
        print(f"Error: {type(e).__name__} - {e}")
        # Handle the division by zero case
    except Exception as e:
        print(f"An unexpected error occurred: {type(e).__name__} - {e}")
        # Handle other types of exceptions
    finally:
        print("This block always executes, whether an exception occurred or not.")

# Eg.
safe_divide(10, 2)
safe_divide(5, 0)
In this example, the safe_divide function attempts to perform a division operation. If a ZeroDivisionError occurs (division by zero), it's caught in the first except block. If any other type of exception occurs, it's caught in the second except block. The finally block always executes, regardless of whether an exception occurred.
Assertions
An assertion is a statement that you add to your code to check if a certain condition holds true. If the condition is false, it indicates a bug or an unexpected situation in your program.
In Python, you use the assert keyword to create an assertion. The syntax is:
assert condition, "Optional error message"

# Example of an assertion with an optional error message
x = 10
y = 0
assert y != 0, "Divisor (y) should not be zero"

# Handling AssertionError
try:
    assert x > 0, "x should be greater than zero"
except AssertionError as e:
    print(f"Assertion failed: {e}")
In this example, the assert y != 0 checks whether the divisor (y) is not zero. If it is zero, the assertion fails, and the program raises an AssertionError with the specified error message.
Considerations When Using Assertions:
- Assertions are typically used during development and debugging. In a production environment, you may choose to disable assertions for performance reasons. To disable it, use the
-O(eg.python -O script.py) command-line option or thePYTHONOPTIMIZEenvironment variable. The-O(optimize) flag turns off assert statements. - Assertions are not meant for input validation from users or external systems. They are more for catching logical errors in your code.
- Assertions should be simple conditions that are easy to check and understand. Avoid complex expressions or side effects.
Advanced Debugging Techniques:
Unit Testing
Unit testing is a software testing methodology where individual components or functions of a program are tested in isolation to ensure that they function correctly. In Python, units typically refer to functions, methods, or classes.
- Unit tests help catch bugs early in the development process, preventing them from escalating into more complex problems.
- Unit tests focus on specific functions or methods in isolation. This allows for pinpointing the source of errors when they occur.
- As code evolves, unit tests act as a safety net, ensuring that new changes do not inadvertently break existing functionality.
How to use unittest
unittest is the built-in testing framework in Python, inspired by Java's JUnit. It provides a test discovery mechanism and various assertion methods for verifying expected behavior
Let's start with a simple example. Suppose we have a function that adds two numbers:
# my_module.py

def add_numbers(a, b):
    return a + b
Now, we can create a corresponding test file:
# test_my_module.py
import unittest
from my_module import add_numbers

class TestAddNumbers(unittest.TestCase):
    def test_add_numbers(self):
        result = add_numbers(2, 3)
        self.assertEqual(result, 5)

if __name__ == '__main__':
    unittest.main()
To run the tests, execute the following command in the terminal:
python -m unittest test_my_module.py
How to use pytest
pytest is a third-party testing framework that offers a more concise syntax and additional features like powerful fixtures, and extensive plugin support.
Using the same example as before, a pytest test might look like this:
# test_my_module.py

from my_module import add_numbers

def test_add_numbers():
    result = add_numbers(2, 3)
    assert result == 5
To run the tests, simply execute:
pytest test_my_module.py
How to Use the Interactive Debugger (PDB)
Python comes with a built-in debugger called PDB (Python Debugger). It allows you to pause the execution of your Python code, inspect variables, and step through your code line by line to find and fix issues.
While print statements and logging are helpful for basic debugging, PDB takes debugging to the next level by allowing you to intervene and analyze your code in real-time.
In your Python script, you start by importing the pdb module. This module provides the functionality for debugging Python code. import pdb
import pdb

def example_function(x, y):
    pdb.set_trace()
    result = x + y
    return result
Setting breakpoints
To start debugging at a specific point in your code, you insert the pdb.set_trace() statement. This line acts as a breakpoint, indicating where the debugger should pause the execution of the program.
def some_function():
    pdb.set_trace()  # This line sets a breakpoint
    print("Hello, World!")
When the program reaches this line during execution, it will pause, and the debugger will be activated.
Starting the Debugger:
There are two ways to start the debugger:
a. Using the break Command:
In Python 3.7 and later versions, pdb introduced the pdb.breakpoint() function as a more convenient and standardized way to set a breakpoint and to address some potential issues with the pdb.set_trace() method.
You can set breakpoints directly in your code using the break command. For example:
import pdb

def some_function():
    # Setting a breakpoint at line 4
    pdb.breakpoint()
    print("Hello, World!")

some_function()
b. Running the Script with -m pdb Option:
Alternatively, you can run your Python script with the -m pdb option, which automatically starts the debugger. For example:
python -m pdb your_script.py
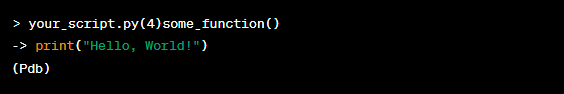
Entering Debugger Mode:
When your code encounters the breakpoint (either set using pdb.set_trace() or pdb.breakpoint()), it enters the interactive debugger mode. This is indicated by the (Pdb) prompt.
Basic Commands:
Now, you can interact with the debugger and use various commands to inspect variables, step through the code, and identify and fix issues.
Some common commands in the pdb debugger include:
n(next): Continue execution until the next line in the current function is reached. If the current line contains a function call, it will not step into the called function.c(continue): Continue execution until the next breakpoint is encountered.s(step): Execute the current line of code and stop at the first possible occasion (either in a function that is called or at the next line in the current function).q(quit): Exit the debugger and terminate the program.break(orb):break [file:]line_numberorbreak [function_name]Sets a breakpoint at the specified line number or function. When the program execution reaches the breakpoint, it will pause, allowing you to inspect variables and step through the code.
By strategically placing breakpoints and using these commands, you can effectively debug your Python code and identify the source of issues in a systematic manner.
| Command | Functionality |
| list (or l) | list or list [first[, last]]: Display the source code around the current line. Optionally, you can specify a range of lines to display. |
| print (or p) | print expression: Evaluate and print the value of the specified expression. This is useful for inspecting variables. |
| break (or b) | [file:]line_number or break [function_name]: Sets a breakpoint at the specified line number or function. When the program execution reaches the breakpoint, it will pause, allowing you to inspect variables and step through the code. |
| help | Displays list of commands or provide information about a specific command or topic(eg. help breakpoints) |
| where | Display a stack traceback of the function calls leading up to the current point in the code. Each line of the traceback typically includes the function name, the file name, and the line number where the function was called. |
Debugger Extensions
Consider using third-party debugging tools and extensions, such as pdbpp, pudb and ipdb, which enhance the functionality of the built-in PDB debugger.
pdbpp provides additional features such as syntax highlighting, tab-completion, and better navigation capabilities.
ipdb is an IPython-based debugger, integrating the powerful features of IPython into the debugging experience. It offers an interactive and user-friendly interface for debugging Python code. It Supports IPython magic commands, making it easier to perform complex debugging tasks.
pudb is a full-screen, console-based visual debugger that provides syntax highlighting and an interactive and visually appealing debugging experience. It includes a visual interface with a code browser, making it easy to navigate through your code.
To use any of them, replace pdb with the corresponding debugger you want to use. For eg. import pdb; pdb.set_trace() with import pdbpp; pdbpp.set_trace() in your code.
Remote Debugging
Remote debugging refers to the process of debugging code that is running on a system or server separate from the development environment. This is commonly used when the application is deployed on a remote server, in the cloud, or on a different device.
You connect your local Integrated Development Environment (IDE) to the remote environment where the code is running.
You can do this in two ways:
- IDE with Remote Debugging Support: Popular integrated development environments (IDEs) like PyCharm, Visual Studio Code, and others provide built-in support for remote debugging.
- pdb or pydevd Library: Python's built-in
pdbmodule can be used for basic debugging. Alternatively, you can usepydevd, a powerful remote debugger.
Remote breakpoints, stepping through code, variable inspection, and other debugging features are employed, similar to local debugging.
IDE Features for Debugging
Most Integrated Development Environments (IDEs) for Python, such as PyCharm, Visual Studio Code, and Jupyter Notebooks, come with powerful debugging features. These include visual breakpoints, variable inspection, and step-by-step execution. Utilize these features to streamline your debugging process.
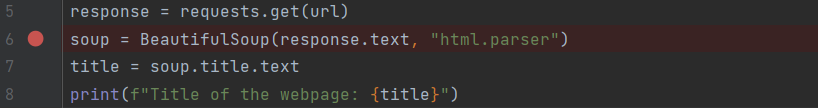
Visual Breakpoints:
Breakpoints are markers that pause the execution of your Python program at a specific line of code, allowing you to inspect variables, evaluate expressions, and understand the flow of your program at that point.
- PyCharm: Simply click on the left margin next to the line number where you want to set the breakpoint.
- Visual Studio Code: Click on the left margin, or use the shortcut
F9. - IDLE: You can add the line
import pdb; pdb.set_trace()at the desired location.
Once a breakpoint is set, run your program in debug mode to stop execution at that specific point.
Stepping Through Code:
After hitting a breakpoint, you can step through your code line by line to understand its behavior. Three common options for this are:
- Step Into (F7): Moves to the next line of code and enters function calls if applicable.
- Step Over (F8): Executes the current line of code and stops at the next line, skipping function calls.
- Step Out (Shift + F8): Completes the execution of the current function and stops at the calling function.

Debuggers in IDEs allow you to execute your code step by step. This includes stepping into functions, stepping over lines, and stepping out of functions. This fine-grained control helps you trace the flow of your program and identify the exact location of an issue.
Jupyter Notebooks support this feature with the help of magic commands such as %debug which allows you to interactively debug a cell.
Call Stack Exploration:
IDEs typically provide a call stack that shows the hierarchy of function calls leading to the current point in the code. This is valuable for understanding the flow of program execution and can be especially useful when dealing with complex applications.
PyCharm, for instance, displays the call stack in the debugger tool window.
Variable Inspection:
Inspecting variables is crucial for understanding how data changes during program execution. IDEs provide a Variables panel where you can view the current state of variables, making it easier to identify bugs. Simply hover over a variable or check the Variables tab to see its current value.
- PyCharm: Utilizes a dedicated "Variables" pane during debugging.
- Visual Studio Code: Provides variable inspection in the "Watch" and "Variables" panes.
- IDLE: Allows you to type variable names in the interactive console during debugging.
Inspecting variables is crucial for understanding how data changes during program execution.
Conditional Breakpoints:
In addition to standard breakpoints, some IDEs allow you to set breakpoints with conditions. This means the debugger will only pause if a specified condition is met. This can be helpful when you want to investigate a specific scenario or condition in your code.
- PyCharm: Right-click on a breakpoint and set conditions.
- Visual Studio Code: Right-click on a breakpoint, select "Edit Breakpoint," and define a condition.
- IDLE: Utilize the
pdblibrary to set conditional breakpoints within your code.
Watch Expressions:
Watch expressions allow you to monitor specific variables or expressions continuously as your program runs. This feature is beneficial when you want to keep an eye on certain values without manually inspecting them at each breakpoint.
- PyCharm: Add expressions to the "Watches" pane to monitor them throughout debugging.
- Visual Studio Code: Use the "Watch" pane to add expressions for continuous monitoring.
- IDLE: While at a breakpoint, type expressions in the interactive console to observe their values.
By utilizing watch expressions, you can track the evolution of specific variables or expressions and identify patterns or unexpected changes during runtime.
There are more tools that IDE provides for debugging purposes like:
- "Python Profiler" in VSCode and the built-in profiler in PyCharm as Profiling Tools.
- "Code With Me" in PyCharm and Extensions like "Live Share" in VSCode for Collaborative Debugging.
Performance Debugging:
Code Linters and Analyzers
Code linters and static analyzers are tools that help identify potential issues in your code by analyzing the source code without executing it. They can catch common programming errors, enforce coding standards, and provide valuable suggestions for improvement.
Here, we'll talk about a couple of these tools – PyLint and mypy – so you can see how to install them and how they work.
How to install PyLint:
pip install pylint
Run pylint on your Python script or module using this command:
pylint your_script.py
When you run PyLint, it generates a detailed report with information about potential issues, coding convention violations, and other insights. The output includes a score for your code, along with messages indicating areas for improvement.
PyLint can be customized to fit your project's specific needs. You can create a configuration file (usually named .pylintrc) to define your preferences. This file can be placed in the root of your project. eg:
[MASTER]
enable = all

[MESSAGES CONTROL]
disable = missing-docstring
In this example, we enable all checks except for the missing docstring check. You can tailor the configuration to match your coding style and project requirements.
How to install mypy:
pip install mypyRun mypy on your Python script or module with this command:
mypy your_script.pyMypy will check your code for type-related issues and provide feedback on potential type mismatches and violations of type annotations.
Mypy is particularly useful when you use type annotations in your Python code. It checks that the types you specify match the actual usage of variables, functions, and other elements in your code.
Let's discuss some other code formatters as well.
flake8
flake8 combines three main tools:
- PyFlakes: This tool performs static code analysis to find errors in your Python code without executing it.
- pycodestyle: Formerly known as pep8, this tool checks your code against the style guide outlined in PEP 8, providing feedback on coding style violations.
- McCabe: This complexity checker identifies complex code blocks that may be harder to understand or maintain.
How to install flake8:
pip install flake8
Similar to PyLint, you can run flake8 on your Python code by executing the following command in your terminal:
flake8 your_file.py
#Replace your_file.py with the actual name of your Python file.
Similar to PyLint, flake8 can be configured to suit your project's requirements. You can create a configuration file (usually named .flake8) in your project's root directory. eg.
[flake8]
max-line-length = 88
extend-ignore = E203, W503
In this example, we set the maximum line length to 88 characters and extend the list of ignored errors.
Black
Black is an opinionated code formatter that automates formatting decisions for consistent and readable code.
Black has a set of formatting rules, and it applies them consistently. This eliminates debates over code style within development teams.
You can install Black using this command:
pip install black
And here's how you use it:
black your_file.py
Black complements traditional linters like PyLint and flake8. You can use these tools in combination to ensure both code quality and consistent formatting.
Many popular editors like Visual Studio Code, Atom, and Sublime Text have extensions or plugins that allow you to use these Code Linters and Analyzers results directly within the editor as you write code.
Profiling
Profiling involves analyzing the performance of your code to identify bottlenecks and areas that can be optimized. Python provides built-in tools and external libraries for profiling, helping developers gain insights into their code's execution time and resource usage.
- Identify Performance Issues: Profiling allows you to pinpoint sections of your code that consume the most time and resources, aiding in optimization efforts.
- Optimize Code: Once bottlenecks are identified, developers can focus on optimizing specific functions or code blocks to enhance overall performance.
- Memory Usage Analysis: Profiling tools can also help in analyzing memory consumption, aiding in the detection of memory leaks and inefficient memory usage.
Python comes with built-in modules for basic profiling. The two main modules are cProfile and profile.
1. cProfile:
cProfile is a built-in module that provides a deterministic profiling of Python programs. It records the time each function takes to execute, making it easier to identify performance bottlenecks.
Example:
import cProfile

def example_function():
    # Your code here

if __name__ == "__main__":
    cProfile.run('example_function()')
This will output a detailed report of function calls, their execution time, and the percentage of total time spent in each function.
2. profile:
The profile module is similar to cProfile but is implemented in pure Python. It provides a more detailed analysis of function calls and can be used when a more fine-grained profiling is needed.
import profile

def example_function():
    # Your code here

if __name__ == "__main__":
    profile.run('example_function()')
Both cProfile and profile produce similar outputs, but the former is generally preferred for its lower overhead.
How to Visualize Profiling Results:
While the built-in modules provide textual reports, visualizing the results can make it easier to understand and analyze. One popular tool for this is snakeviz.
Installing snakeviz:
pip install snakeviz
Using snakeviz:
import cProfile
import snakeviz

def example_function():
    # Your code here

if __name__ == "__main__":
    cProfile.run('example_function()', 'profile_results')
    snakeviz.view('profile_results')
This will open a browser window displaying an interactive visualization of the profiling results.
Advanced Profiling Techniques:
While the built-in profiling tools offer valuable insights, more advanced techniques and external libraries can provide additional information.
Line Profiling:
Line profiling allows you to see how much time is spent on each line of code within a function. The line_profiler module is commonly used for this purpose.
Installing line_profiler:
pip install line_profiler
Using line_profiler:
from line_profiler import LineProfiler

def example_function():
    # Your code here

if __name__ == "__main__":
    profiler = LineProfiler()
    profiler.add_function(example_function)

    profiler.run('example_function()')

    # Display the results
    profiler.print_stats()
This will show a detailed report with the time spent on each line within the example_function.
Memory Profiling:
Understanding memory usage is crucial for optimizing code. The memory_profiler module helps in profiling memory consumption.
Installing memory_profiler:
pip install memory-profiler
Using memory_profiler:
from memory_profiler import profile

@profile
def example_function():
    # Your code here

if __name__ == "__main__":
    example_function()
When executed, this will display a line-by-line analysis of memory usage during the execution of the example_function
Understanding memory usage is crucial for optimizing code. The memory_profiler module helps in profiling memory consumption.
While these techniques cover a broad range of debugging scenarios, it's important to note that the most effective debugging often involves a combination of these methods. Additionally, understanding the specific context and the type of problem you're dealing with will guide you in choosing the most appropriate technique.
Some Additional Tips for Efficient Debugging:
- Version Control and Git Bisect: Leverage features provided by your version control system to track changes and revert to working versions if needed.. If the bug was introduced recently and you have version control (e.g., Git) in place, using git bisect can help you identify the exact commit that introduced the issue.
- Documentation and Code Comments: Writing well-documented code and comments can help in understanding the purpose of specific functions or code blocks, making debugging more straightforward for both you and others who might work on the code.
- Break Down Complex Problems: Divide large code blocks into smaller, testable functions for easier debugging and maintenance.
- Take Breaks: Stepping away and returning with a fresh perspective can often reveal solutions that weren't apparent earlier.
- Rubber Duck Debugging: It's like having a therapy session for your code, except the therapist is a rubber duck. Imagine you're stuck on a tricky coding issue. Instead of asking a person for help, you talk to a rubber duck. Yes, an actual rubber duck! You explain your code to the duck, line by line, as if it understands everything. Even though the duck is quite rude and doesn't reply, something magical happens. By talking through your problem out loud, you start to see the solution yourself.
How to Search for Solutions to Bugs and Errors
1. Effective Search Strategies:
- Understand the Error Message: Start by understanding the error message or bug description. Identify key terms and error codes that can be used in your search.
- Include context details: for example, operating system, version number of the software, libraries, or frameworks you are working with. Bugs and solutions can vary between different versions.
- Quotation Marks: Use quotation marks to search for an exact phrase. This is useful when searching for specific error messages or code snippets.
- Use Descriptive Keywords: Use specific and descriptive keywords related to the error. Include programming languages, frameworks, and relevant technologies in your search. Whenever possible, include code snippets or examples in your search query. This can narrow down results to those including practical implementations.
2. Leveraging Web Resources:
- GitHub Repositories: Search GitHub repositories for similar issues. Many projects have issue trackers where users discuss problems and solutions.
- Documentation and Manuals: Check official documentation and manuals for the technologies you are using. Sometimes, the answer might be found in the official documentation.
- Site-specific Searches: Use the "site:" operator to search within a specific website or domain. This can be useful when looking for solutions on particular forums, documentation, or blogs.
- Some useful forums/sites are: Stack Overflow, GitHub discussions, Reddit, and other developer communities. These platforms often have discussions about common bugs and their solutions.
These are the ways how you can find the solution for your problem. Even if you don’t find an exact match to your problem, similar issues might provide insights into potential solutions.
If you can't find a solution at all, consider posting your problem on relevant forums or communities. Others may have faced similar issues and can offer assistance.
Bug resolution may require some patience. Be persistent and try different search queries, especially if the issue is complex.
Conclusion
In this debugging handbook, we've explored common error messages, learned effective search strategies, and discovered the practical utility of print statements.
Debugging is an integral part of the software development process. It's an art of patience, persistence, and problem-solving. By employing a combination of print statements, logging, built-in debugging tools, and third-party utilities, you can effectively identify and resolve issues in your Python code.
Developing good debugging habits and leveraging the available tools will not only save you time but also enhance the overall quality and reliability of your programs.