Syntax Error #11: Debugging Python
This January I share my tips for debugging Python, based on a talk I've done in PyCon Sweden conference and archipylago meetup lately.
Happy 2024! I hope this year your software experiences less bugs and brings more joy to everyone developing and using it.
Today's newsletter is a written-form presentation of the most recent version of my talk Debugging Python that I've given last November in PyCon Sweden and last week in archipylago meetup. I have previously published it on my personal blog.
It refers to a bunch of things I've already written on this newsletter so if you're a long-time reader, you'll get an extra benefit of repetition on your path to mastering debugging.

What is debugging?
In essence, debugging is the process of figuring out what’s wrong when the computer says no. That could manifest itself as an error (software crashing) or logical error (software doing something in a way it’s not meant to do). The ones that come with an error are usually a bit easier to start with because there’s a starting point for you to do your detective job. That doesn’t mean they are easy to solve though.
I really like this quote:
“Debugging starts with your current body of knowledge and ends by answering the question: What is happening?” - Ryan Zezeski
We all start somewhere: we have some context in our mind about the current codebase, feature, and - if it’s a recently developed feature - issue at hand. We then apply different actions, using tools and techniques, to discover more and pin point what is actually happening.
This blog post (and my usual definition of debugging) does not discuss solving those problems (by writing code) or mitigating them (by writing tests, documentation, code reviews and so on). I focus on things that help developers become better and more efficient in finding what’s wrong.
There are two main parts to my approach: the debugging mindset which includes non-technical things and tools & techniques which includes tooling used on the computer to debug. You need to master both to become efficient. If you’re great with the mindset but don’t know the tools, you’ll likely reach the goal but it will be slow and very manual. If on the other hand, you know the tools well but don’t have a good mindset, you might end up doing unnecessary things.
Debugging mindset
What do you do when you notice something is wrong? Depending on the situation and timing, it may cause a panic response. It’s Friday afternoon and you notice something’s broken in production and the pressure might set in.
Take a break
In my opinion, the most important first step is to stop, take a deep breath and assess the situation. Rushing only leads to more issues in the long run. You should make sure you understand what happened and follow the steps of debugging.
One thing I see way too often experienced developers do (and I’ve been guilty of it myself too) is make guesses. We have a tendency to think we know what’s happening and why and jump right into the code. Then we try to read the code to identify the problem. It doesn’t work because software is complex and mistakes often really difficult to spot. Especially when we think what the outcome should be and it makes us not see the problems.
Step-by-step process
Instead of making guesses and assumptions, it’s best to adopt a process. A step-by-step approach where you double check everything and don’t let yourself jump to conclusions. The process is iterative and you repeat it every time making small progress until you finally reach either a dead end or the solution.
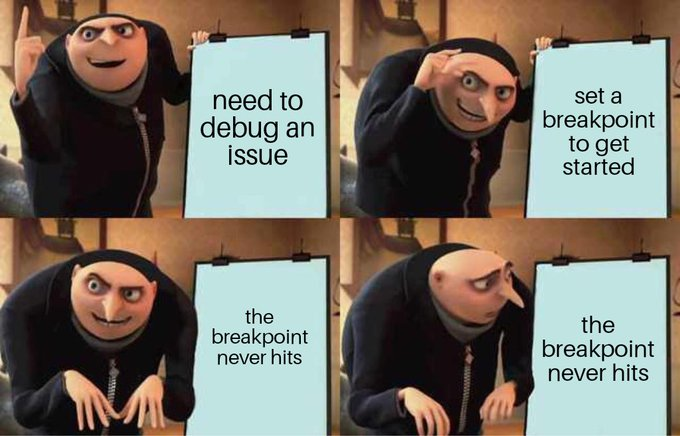
The first, crucial step is to make sure the code you think is running, is actually running. The above meme from @JenMsft’s tweet is so spot on. I can’t emphasise the importance of this enough. There are many reasons this could happen and if you let the tunnel vision take over, it’s easy to miss them.
First, it might be that the code you’re modifying and the software you’re running are not the same. Maybe you’re accidentally running the production or staging site of your web application instead of your development. Been there, done that. Or maybe an older dev server is running on different code and overriding your later dev server. Or the automatic build tool isn’t picking up the changes and updating your software.
In all of these cases, I first make a small change, usually a visual one, to make sure it gets picked up. Add a 1 to a heading and reload your software. If things aren’t changing, you’ll avoid wasting a lot of time figuring out why your fixes aren’t working.
Second, it might be that your assumption of the flow inside the codebase isn’t correct. Maybe an API end point you think should be called isn’t or a different function is responsible for it. Printing something like print("::DEBUG:: Code was run") helps you confirm your assumptions quickly. We’ll talk more about printing in just a bit.
Talk to them ducks
Rubber duck debugging is a wonderful technique for solving problems. You may have heard about it before. It’s partly an inside joke in the industry but it also works.
In rubber duck debugging, you pick your favorite duck and ask it to help you. You explain your situation, what you’ve tried so far and what you think might be the issue - the same way you would ask a colleague. Often, before the duck has time to reply, you’ve figured the issue out yourself.
One reason why this works so well, is that we tend to be very good at skipping details when we think about them. We convince our own brain that we did something or definitely tried that other thing, omitting crucial details. When we talk about them to someone else, we tend to not skip so much because we know they are important and then we notice what we actually missed earlier.
If there’s a shortage of ducks at your location, I’ve found brain dump to be a alternative solution. I take a page or two from my notebook and write down the things I would have told the ducks. What’s the problem, what have I tried, what I think the problem is. I then go for a walk and think about something completely different or take a nap. The subconscious keeps working once we stop the conscious solving part.
Tools & Techniques
Let’s then take a look at the Python specific tools and techniques.
Printing is the best debugging tool
Printing to the console is the thing we usually learn first when we start learning programming or pick up a new language. And it has a lot of uses in building software.
I argue printing is the best debugging tool. It seems to be controversial and every time I talk about it, I get a lot of questions and comments from people who say their teammates or mentors or more senior developers tell them to not use print and make them feel bad for doing so. Some people feel like printing is not “advanced enough” to be used if you’re an experienced developer.
The reason printing is the best tool – despite not being the most powerful or more advanced – is because it has the lowest friction. Everyone knows how to do it, you don’t need to install any new libraries and you don’t need to configure anything. You just throw in a print statement and run your software and then read the output. It takes only a few seconds to add it in and you can do it with pretty much any codebase, no matter how familiar you are with it.
With Python, we use print() function to print things:
print('::DEBUG:: This code was run')Since Python 3.6, we’ve had access to f-strings (with a helpful fstring.help cheatsheet page) that make it easier to add variables and expressions inside prints:
user = 'Juhis'
print(f'{user} logged in')
# Prints "Juhis logged in"
And if you’re doing something like this:
print(f'user = {user}, email = {email}')you can shortcut it with
print(f'{user=}, {email=}')Printing is a good way to quickly examine what different variables in our code store.
But it can also become a bit cumbersome and slow when you need to do a lot of exploration as it requires you to run the software again every time you make changes.
Snoop is a toolkit for more
The next step is to use tools from snoop library. The basic usage of snoop is to decorate a function with it and get a line-by-line output of the execution with all the state changes printed out. From their example in readme:
import snoop

@snoop
def number_to_bits(number):
    if number:
        bits = []
        while number:
            number, remainder = divmod(number, 2)
            bits.insert(0, remainder)
        return bits
    else:
        return [0]

number_to_bits(6)
when ran, will print
15:42:39.18 >>> Call to number_to_bits in File "/example.py", line 4
15:42:39.18 ...... number = 6
15:42:39.18    4 | def number_to_bits(number):
15:42:39.18    5 |     if number:
15:42:39.18    6 |         bits = []
15:42:39.18    7 |         while number:
15:42:39.18    8 |             number, remainder = divmod(number, 2)
15:42:39.18 .................. number = 3
15:42:39.18 .................. remainder = 0
15:42:39.18    9 |             bits.insert(0, remainder)
15:42:39.18 .................. bits = [0]
15:42:39.18 .................. len(bits) = 1
15:42:39.18    7 |         while number:
15:42:39.18    8 |             number, remainder = divmod(number, 2)
15:42:39.18 .................. number = 1
15:42:39.18 .................. remainder = 1
15:42:39.18    9 |             bits.insert(0, remainder)
15:42:39.18 .................. bits = [1, 0]
15:42:39.18 .................. len(bits) = 2
15:42:39.18    7 |         while number:
...
You can see from the example output how it prints each iteration of the while after each other, showing how the values change. This is handy when you have multiple variables that keep changing as you only need to run it once and you’ll get all the changes for all the variables in scope.
snoop.pp is a function that can be used to print values in the middle of expressions. It prints the argument passed in and also returns it so it can be put in anywhere:
from snoop import pp
x = 1
y = 2
pp(pp(x + 1) + max(*pp(y + 2, y + 3)))
prints
12:34:56.78 LOG:
12:34:56.78 .... x + 1 = 2
12:34:56.78 LOG:
12:34:56.78 .... y + 2 = 4
12:34:56.78 .... y + 3 = 5
12:34:56.78 LOG:
12:34:56.78 .... pp(x + 1) + max(*pp(y + 2, y + 3)) = 7
I find its biggest weakness to be that cleaning them up after you’re done with your debugging session becomes a bit much work, especially if used a lot inside complex expressions.
This works similar to another library called icecream which it is inspired by.
Finally, snoop offers a way to combine snoop with a great debugger called birdseye. I’ll talk more about this at the end of the debugger section below.
Debuggers
The third “level” of debugging tools are debuggers. On the base level, what a debugger does is that it suspends the execution of code at a given point and injects you into it. It then gives you granular control to move around in the code, executing lines and running arbitrary Python code to examine it further.
Compared to printing or snooping, the power of debuggers is that you don’t have to keep making changes and re-running the code every time you want to see something different. You’ll have powerful access to the code with Python’s great REPL interface to try things out and follow the code step by step to find out the issue.
Python community has built many debuggers so everyone can find one that fits their flow the best. I’ll introduce few of my favorites here but there are many many more.
Controlling the debugger with
You can choose which debugger to use by defining it in PYTHONBREAKPOINT environment value.
# Run IPython Debugger (replace `ipdb` with any other debugger)
PYTHONBREAKPOINT=ipdb.set_trace

# Don’t stop on breakpoint()s
PYTHONBREAKPOINT=0

# Run default Python Debugger
PYTHONBREAKPOINT=
To choose a non-default debugger, you can set PYTHONBREAKPOINT to the set_trace function of your favorite debugger (you need to install them!).
By setting the value to 0, you can skip all breakpoints which can be handy to set on a production environment or CI to make sure things don’t stop if a breakpoint accidentally makes its way to production code.
Finally, by setting it to empty string (or not setting it at all) will use the default Python Debugger.
Invoking the debugger
To kick off a debugger, you need to add breakpoint() to your code in a line where you want to suspend the execution:
def find_collection(collection_name):
    url = f"{BASE_URL}/Collections"
    req = requests.get(url)
    content = req.content
    soup = BeautifulSoup(content, “html.parser")
    breakpoint()
    collection_tds = soup.css.select(f"#{collection_name}table td")
When the code execution hits this function and then the line 6, it will start the debugger and you’ll be able to examine the state of the program and move around.
The default Python debugger is called pdb or The Python Debugger. It looks very similar to the Python REPL but adds a bunch of helpful commands for operating the debugger. A couple of the most helpful ones are:
(n)ext(the letter in parentheses is a shortcut for the entire command), you can execute current line and move to the next. If there’s a function call on that line, it gets executed completely.(s)tepdoes the same as next but it enters functions when called.(w)hereprints the current stack trace, letting you know exactly where in the execution you are.(u)pand(d)ownmove you up and down in the stack.(c)ontinue, you can run the code until the next breakpoint (or end of script).
ipdb - IPython Debugger
If you’re used to running IPython as your REPL, you’ll be right at home with the IPython Debugger. It combines the functionality of the pdb with IPython REPL’s functionality.
PuDB debugger
PuDB is a terminal UI debugger, starting a multi-pane debugging session:
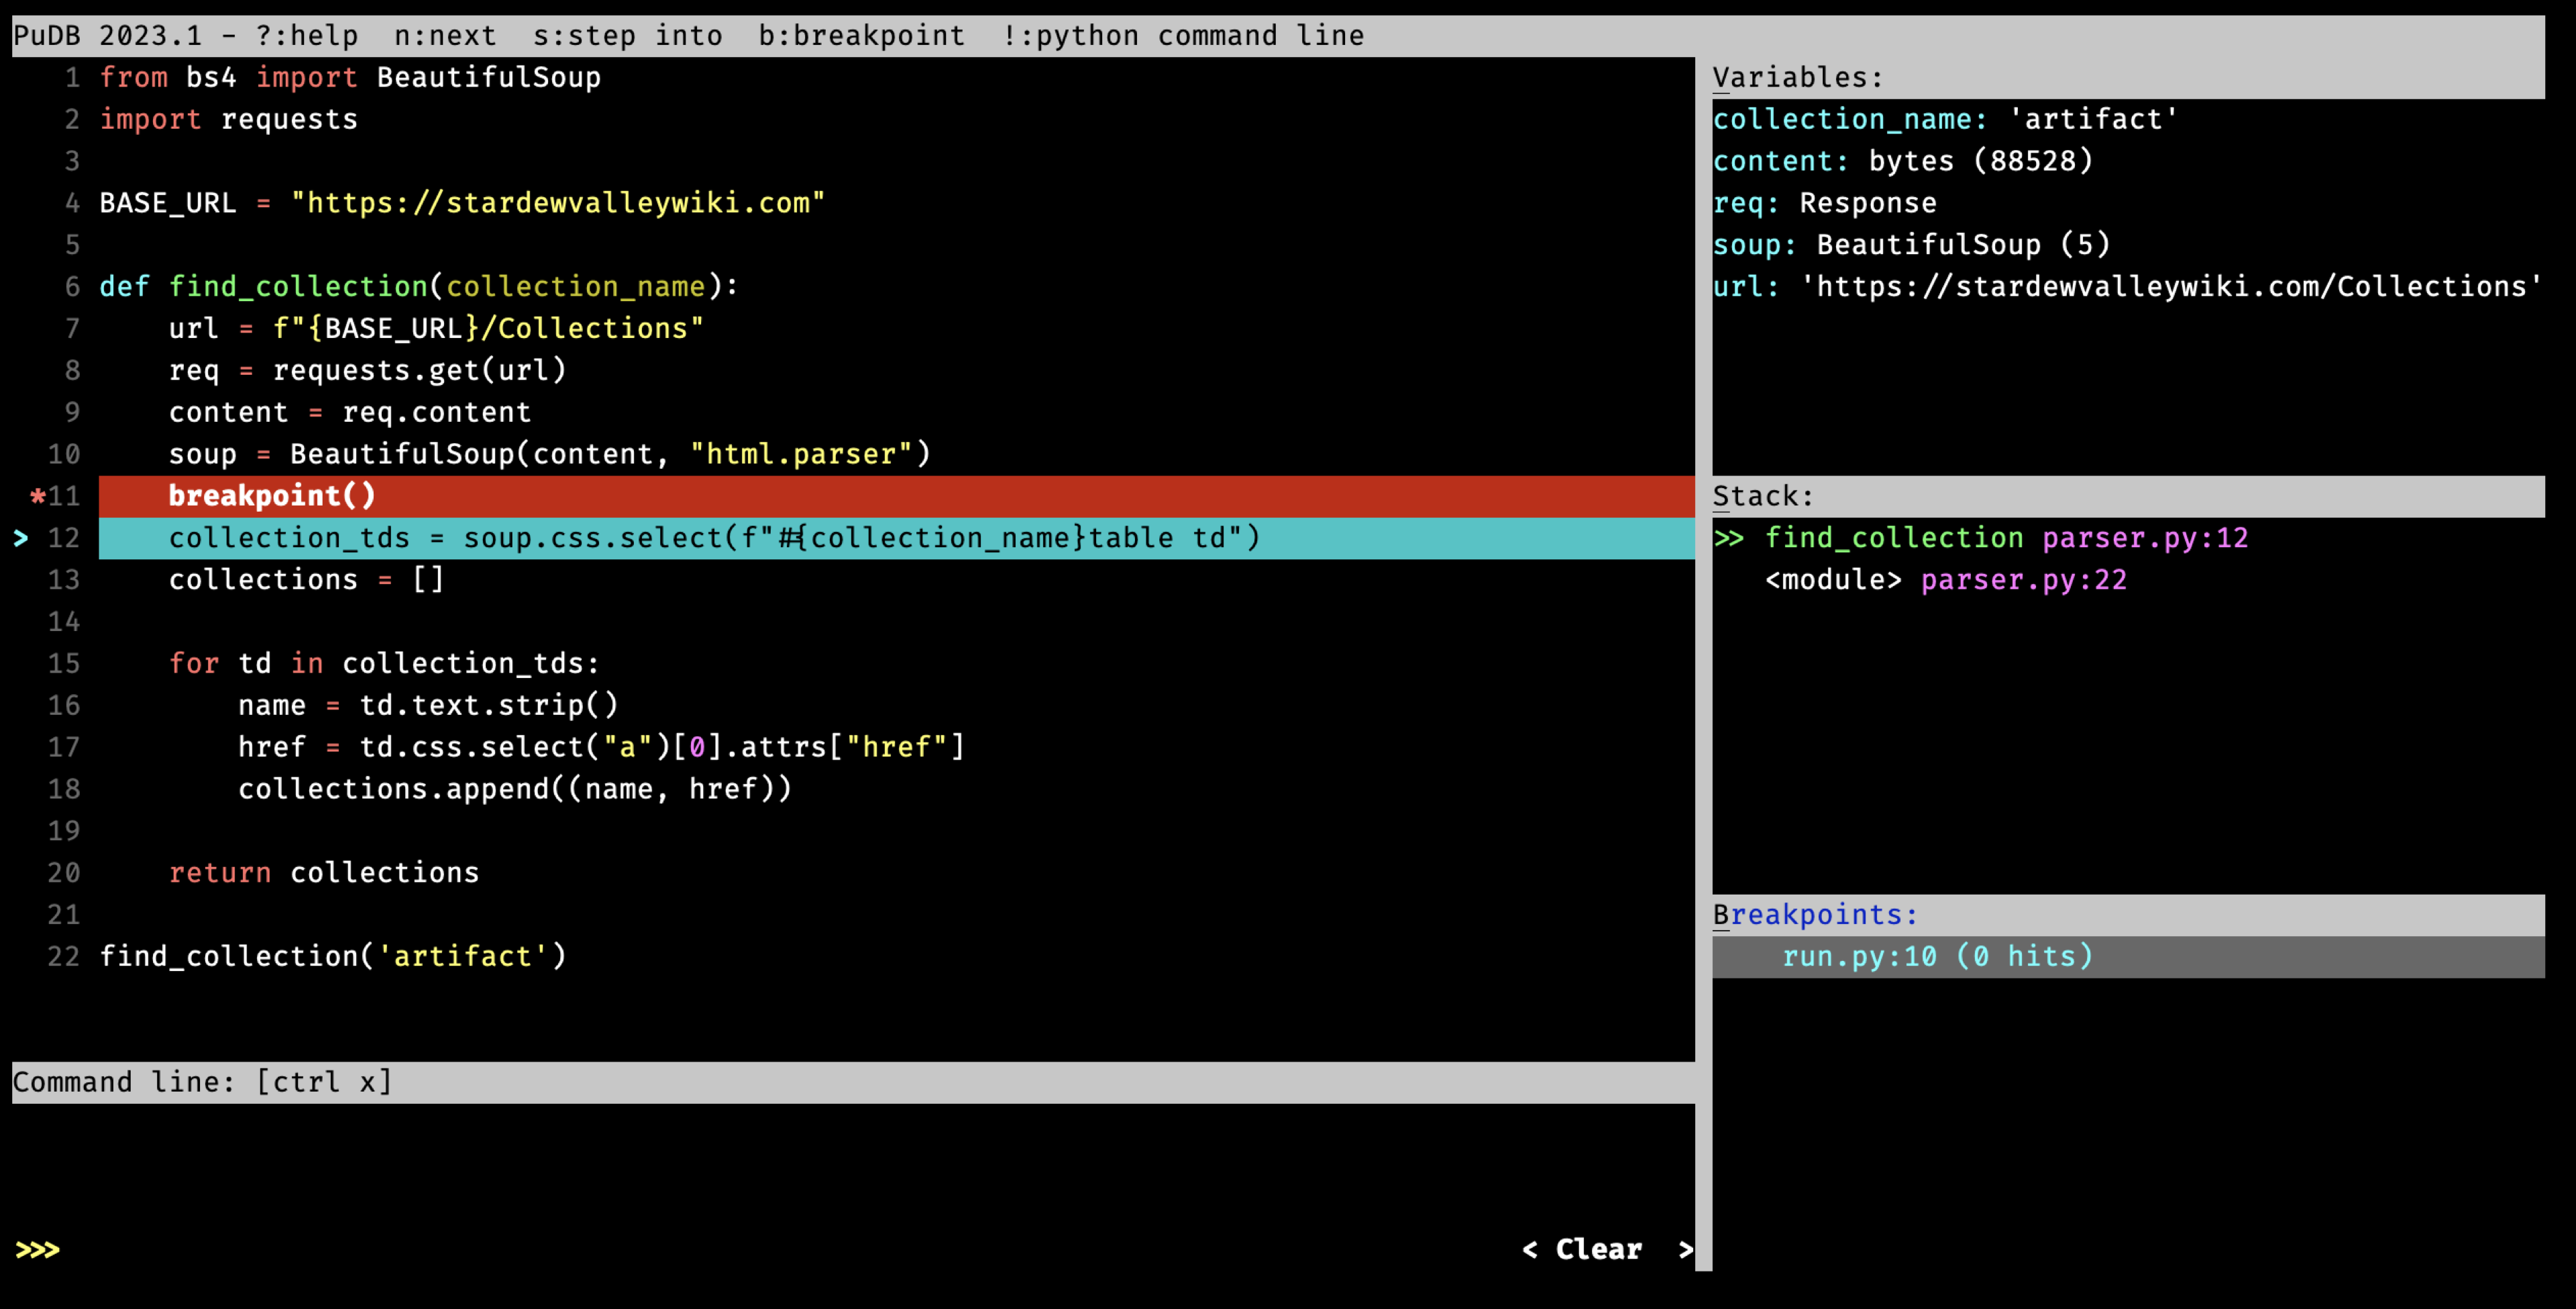
Compared to pdb and ipdb, a big benefit is seeing many things at once. You can see the code currently being run, the current local variables, stack and breakpoints. And there’s still space for the REPL.
Terminal UIs can take a bit to get used to if you haven’t used them a lot.
If you’re more used to web interfaces, check out the next debugger, web-pdb
web-pdb debugger
web-pdb starts a local web server when invoked with breakpoint() and offers a similar multipane view like PuDB but on your browser:
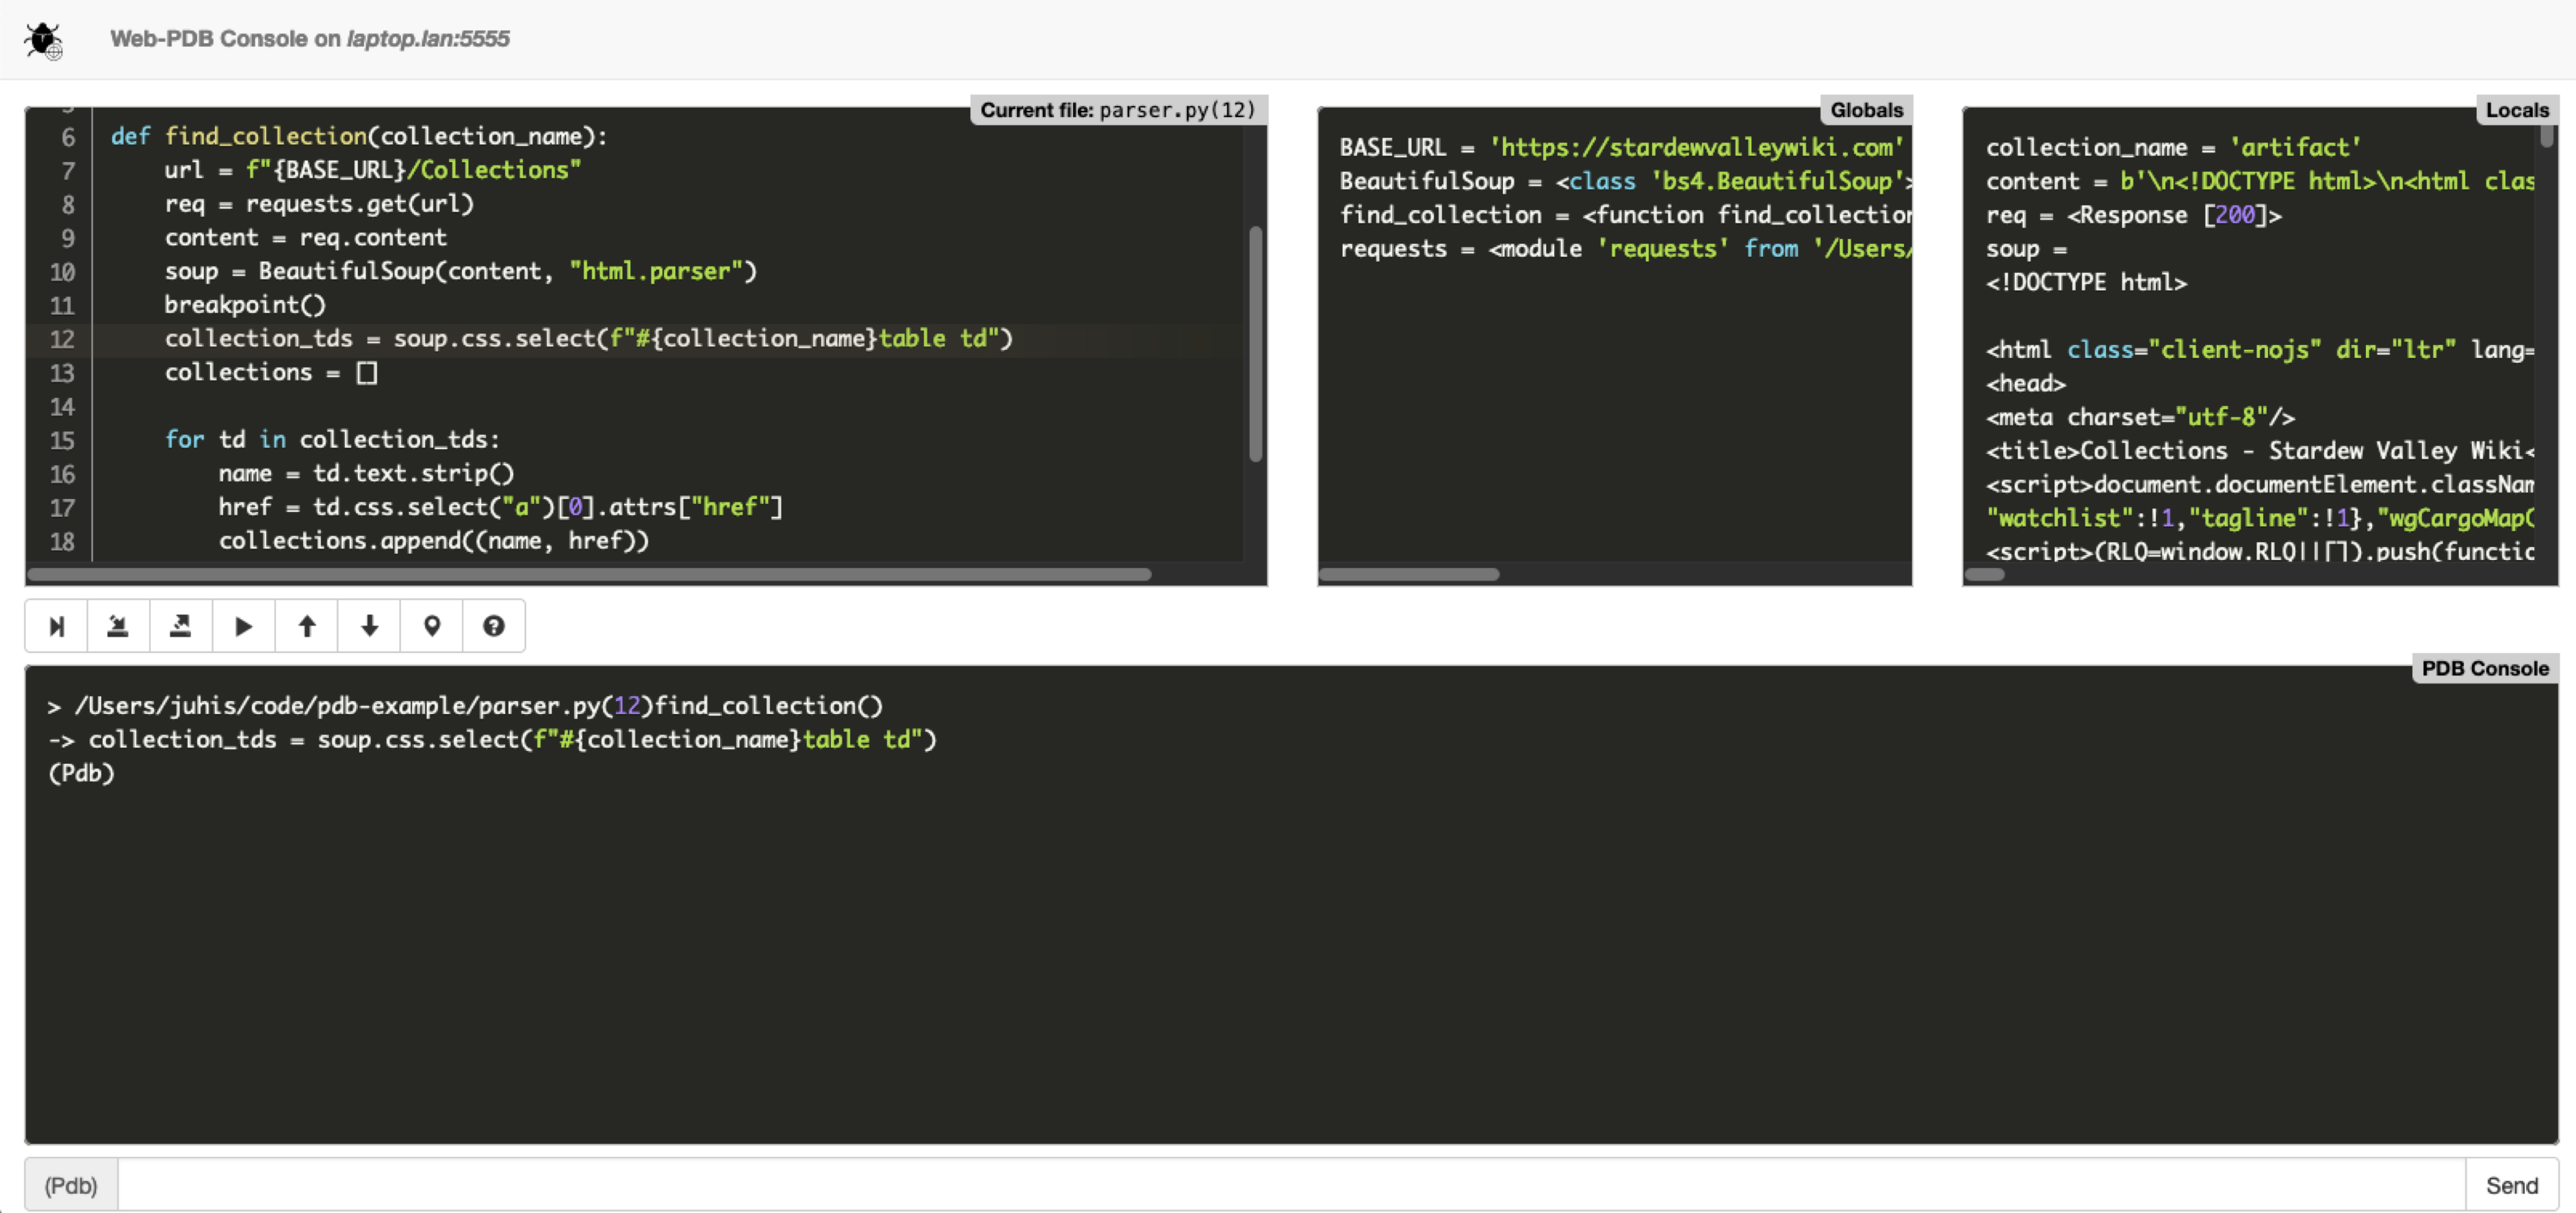
It gives you similar panes with code and variables and the pdb REPL but also buttons that can be clicked with a mouse. I find it a good alternative to PuDB if you don’t like navigating in terminal.
birdseye
For me, the most impressive of the debuggers is the birdseye debugger I mentioned earlier. To debug a function, you decorate it with birdseye.eye (or with snoop.spy):
from birdseye import eye

@eye
def find_collection(collection_name):
  ...
You then call your function by running the code and it records the execution. To view it, you can start the birdseye web server with python -m birdseye and navigate to it with your browser.
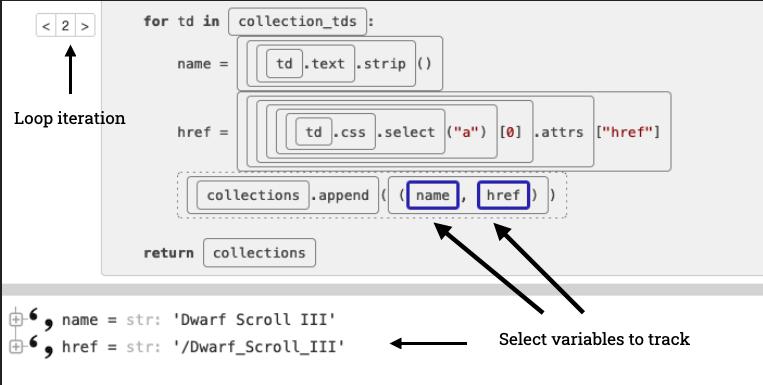
What makes birdseye so good is that it gives you very granular view into what’s happening. Not only can you view the value after a line has finished running but you can see the outcome of individual expressions within any line:
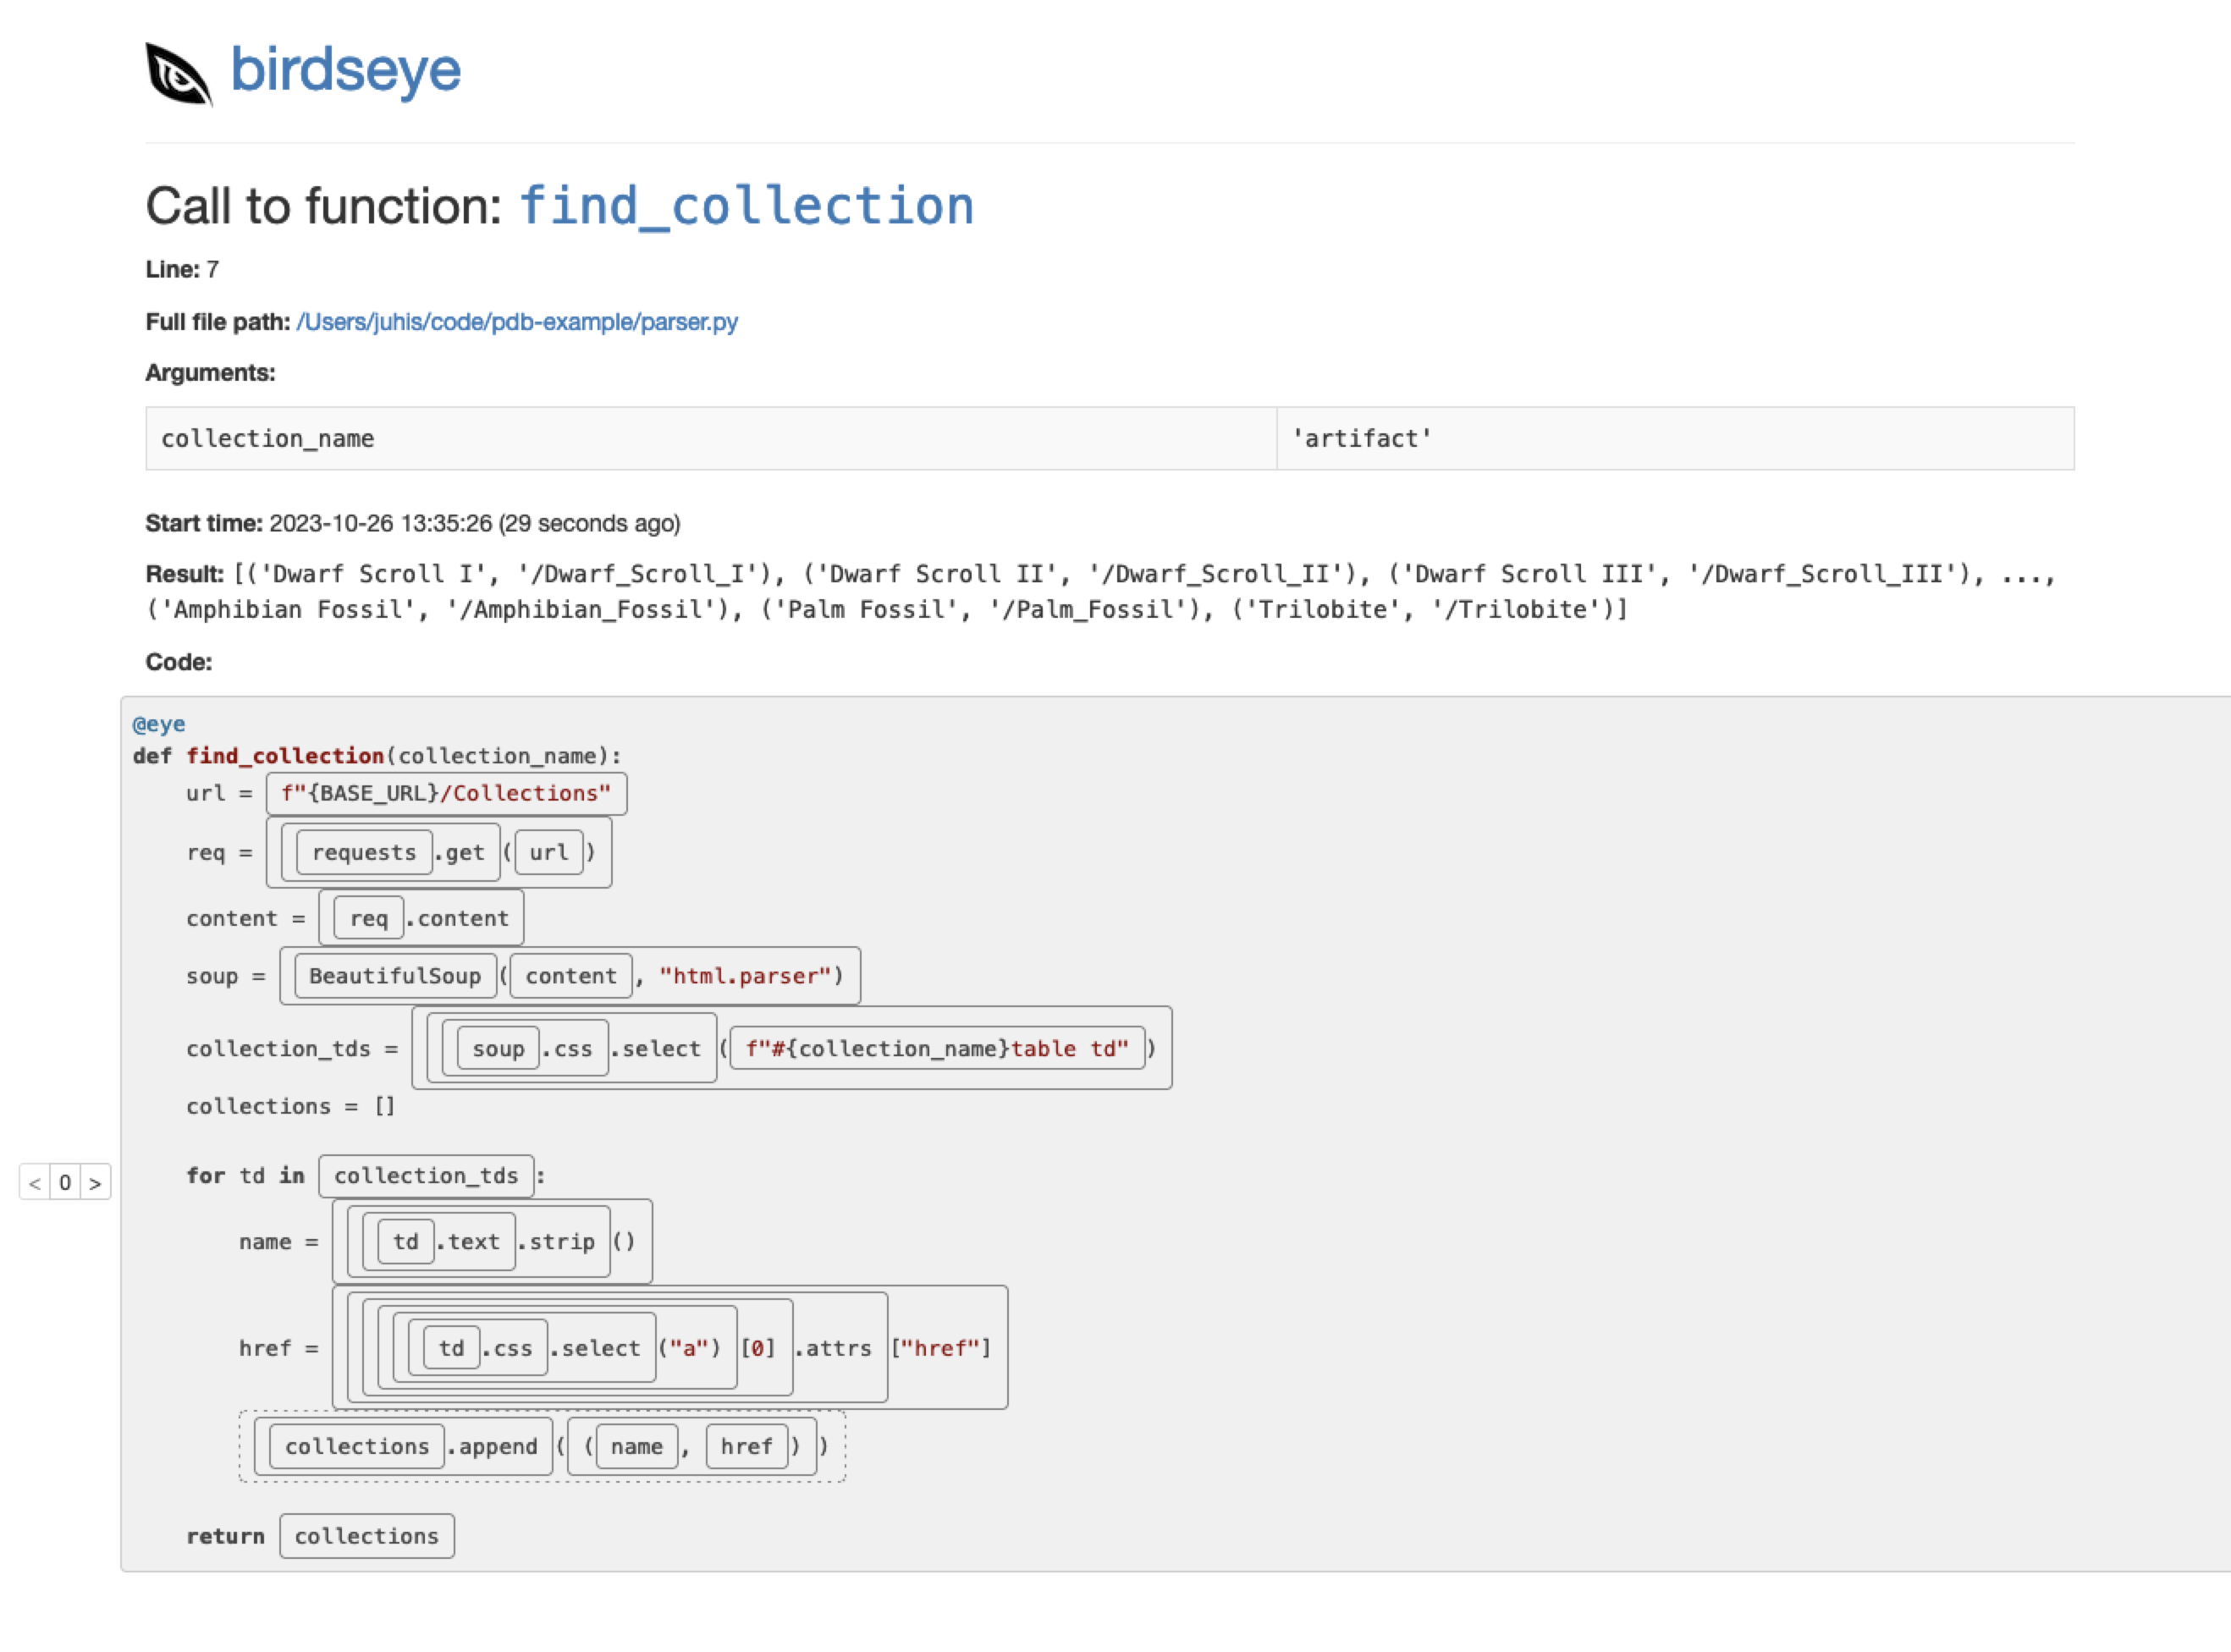
Every rectangle in the image above is a expression you can examine by clicking it. You can click multiple ones to keep watching them.
And for loops, you can adjust the iteration counter on the left to see what the values were on each iteration separately. I love it.
Birdseye balances nicely the amount of information it records (which is a lot) with how much you see (which you control).
It has a slightly different approach than other debuggers so it may not be the best solution for every situation and I often find myself combining it with other debuggers (and printing) depending on the type and difficulty of bugs.
Quick-fire Django tooling round
A couple tools used for debugging Django apps specifically, without going into them in-depth.
Debugger in templates
To trigger a debugger from Django templates, add this to your custom filters:
@register.filter
def pdb(element):
    breakpoint()
    return element

## And use it in templates

{{ msg | pdb }}
Django Debug Toolbar
Django Debug Toolbar is a library that adds a debugger sidebar to the frontend. It lets you examine requests made, SQL queries ran and other handy information.
Kolo
Kolo is a new VS Code extension that offers much of the same information than Django Debug Toolbar but inside your VS Code. If you’re using that to edit your code, it’s handy to have the information directly in your code editor. Kolo is still currently in beta but I think it’s worth checking out.
As it’s a development-only tooling, I see way less issues in already picking it up as part of your workflow compared to something that would get shipped as part of the production app.
Story time
A reader shared with me a service that allows you to practice your Linux server admin troubleshooting and debugging skills. SadServers offers a variety of scenarios that lets you practice the core skills (and learn new ones) in an environment that is less stressful than your own server crashing on Friday afternoon and having to figure out what's going one.
They describe their service as
There's a collection of scenarios, a description of what's wrong and a test to check if the issue has been solved. The servers are spun up on the spot, users get an "SSH" shell via a browser window to an ephemeral server (destroyed after the allotted time for solving the challenge) and then they can try and solve the problem.
Problems include common software that run on Linux, like databases or web servers although knowledge of the details for the specific application is not necessarily required. It also includes scenarios where you do need to be familiar with the technology with the issue, for example, a Docker scenario. The scenarios are for the most part real-world ones, as in they are similar to issues that we have encountered. - SadServers FAQ
Thanks Douglas for sharing the site!
Syntax Error is created with love by Juhis. If you liked it, why not share it with a friend? Or if you have any feedback or just want to say hi, hit reply. I'm always happy to hear from my readers and learn about what you do and how you debug your issues.